How are this year's sales doing against last year?
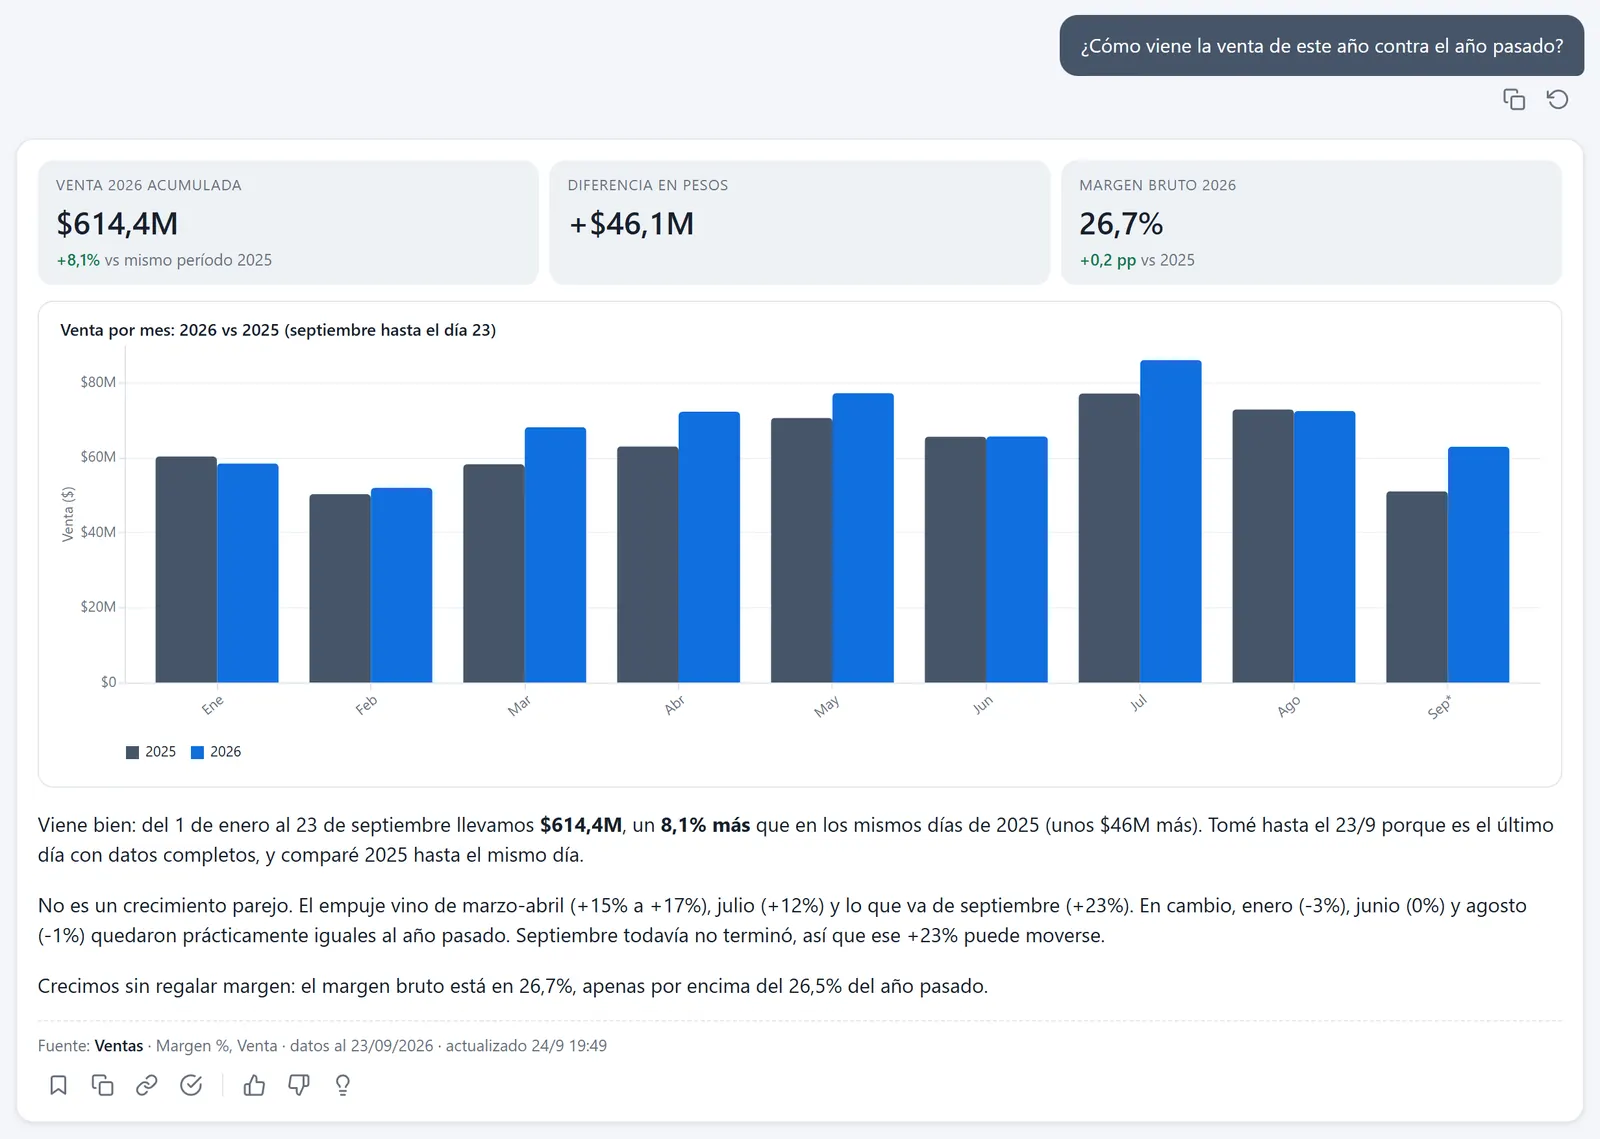
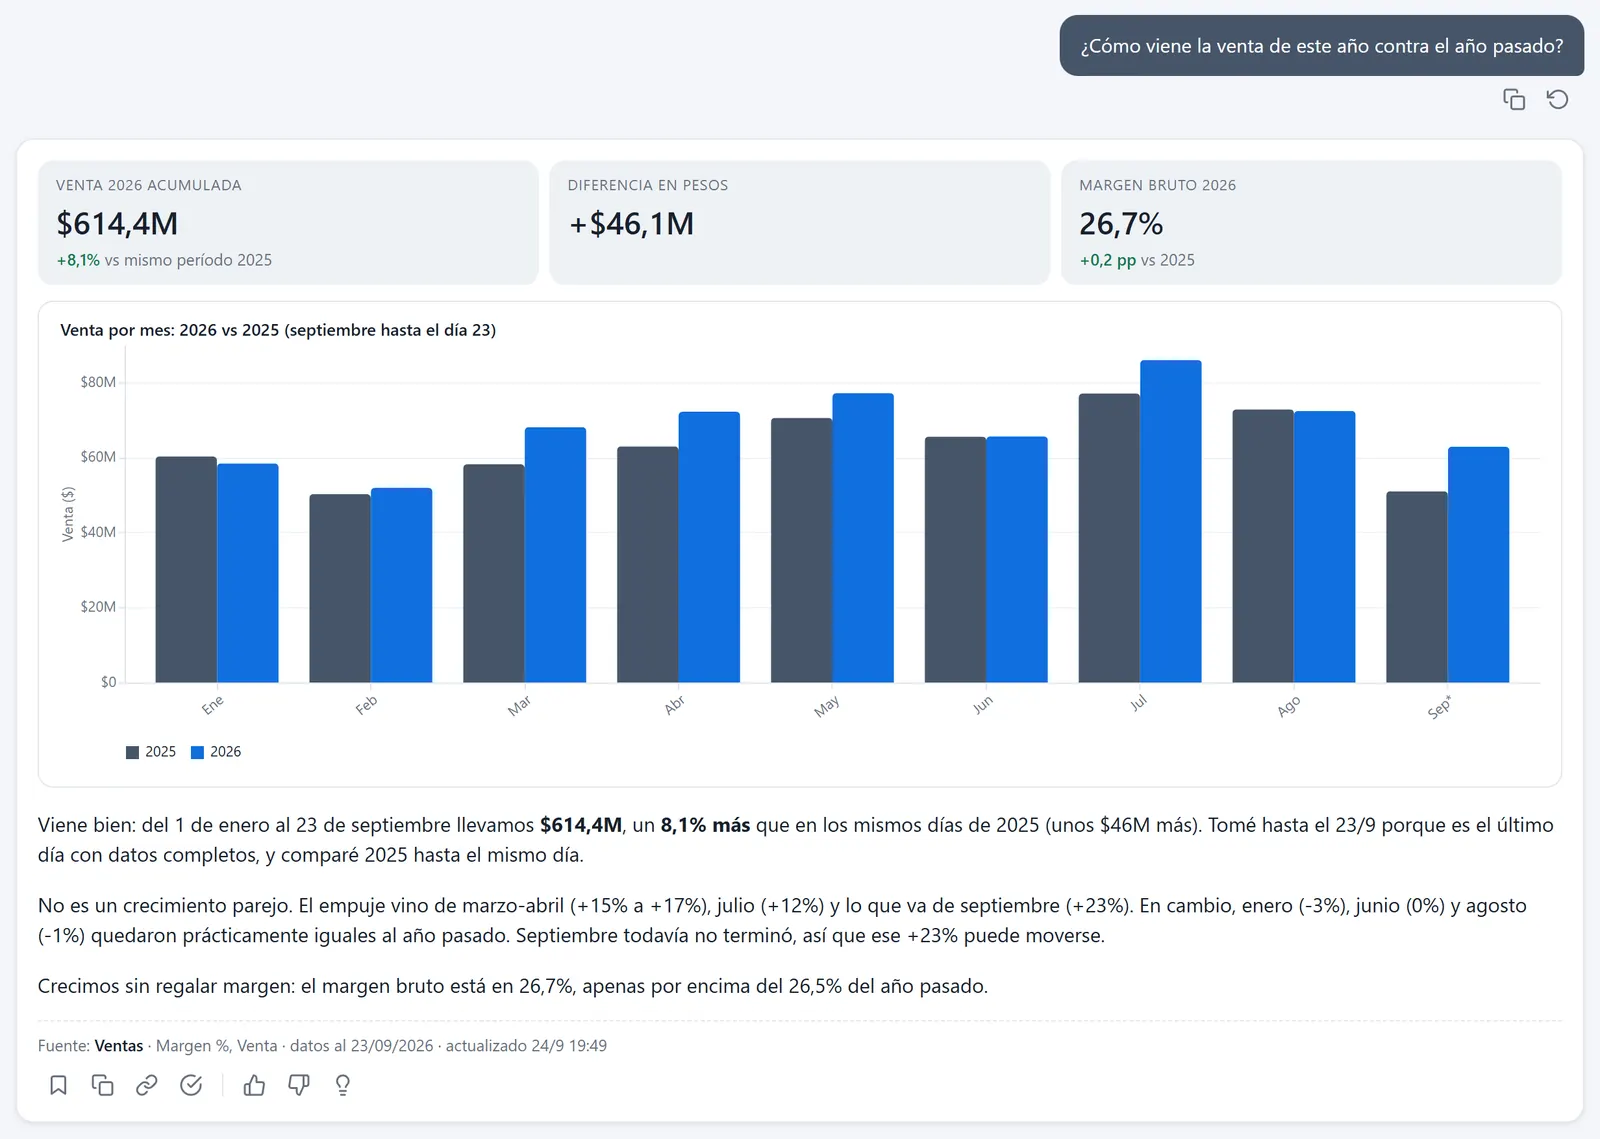
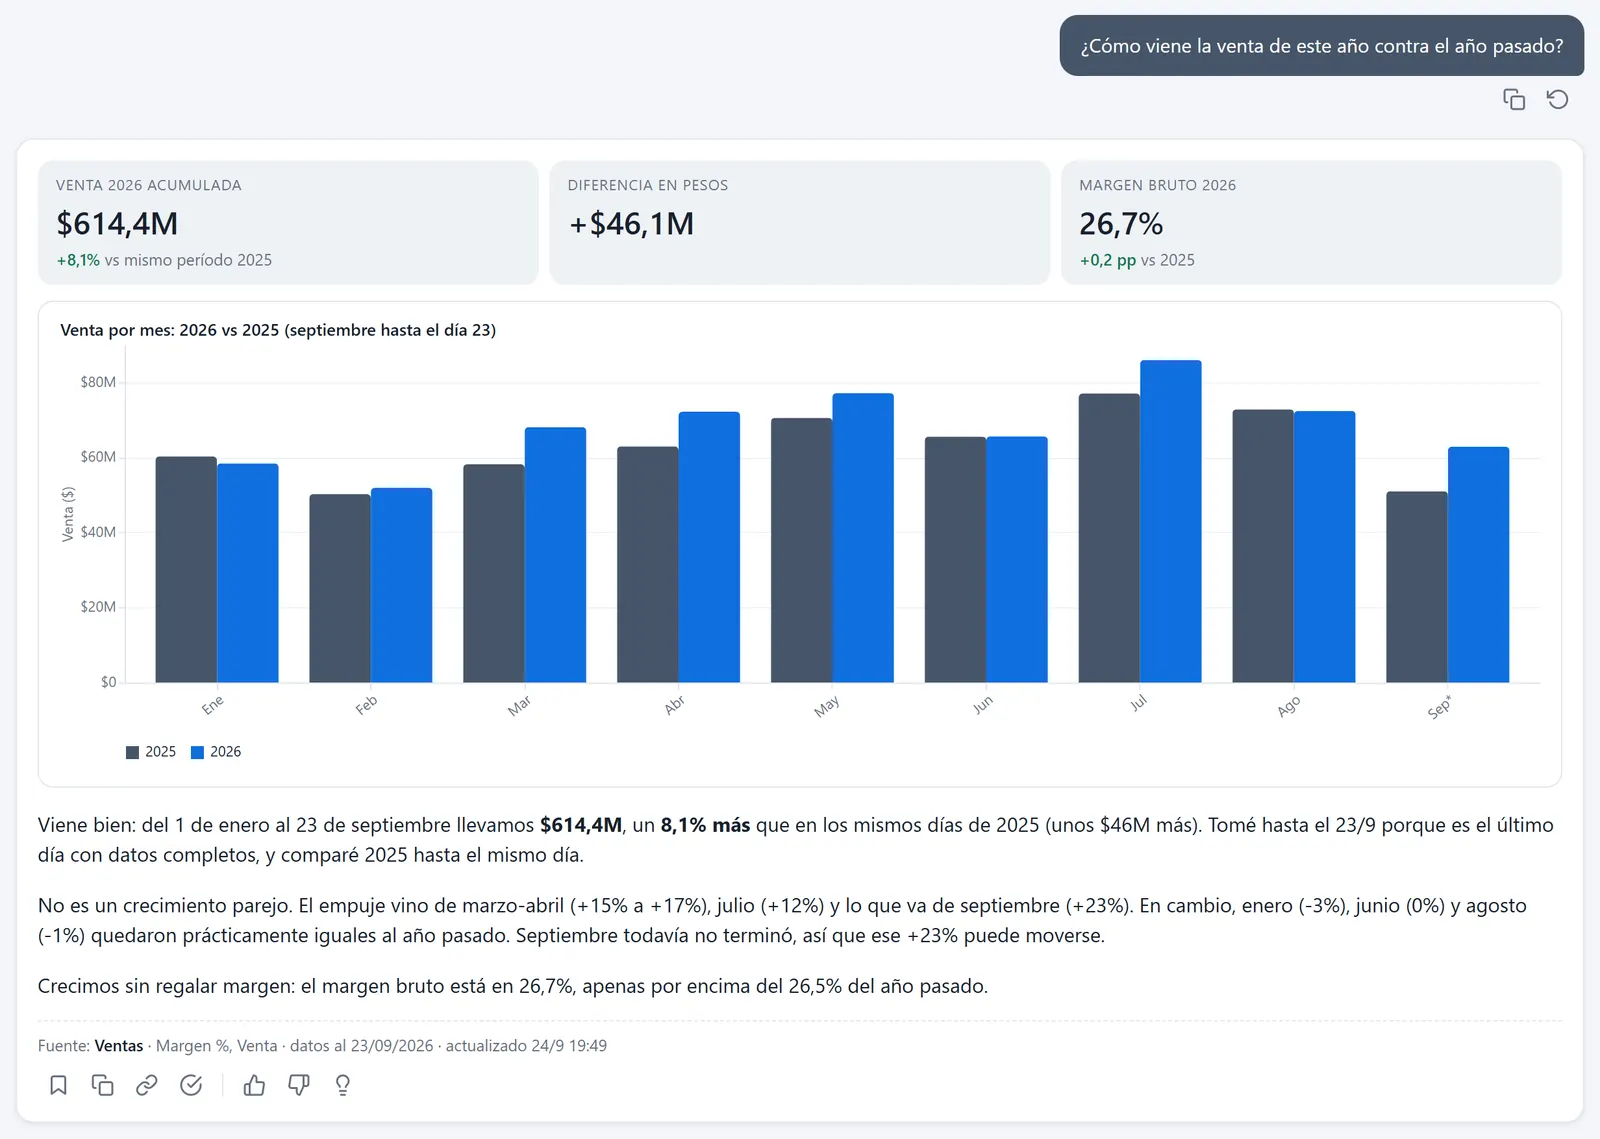
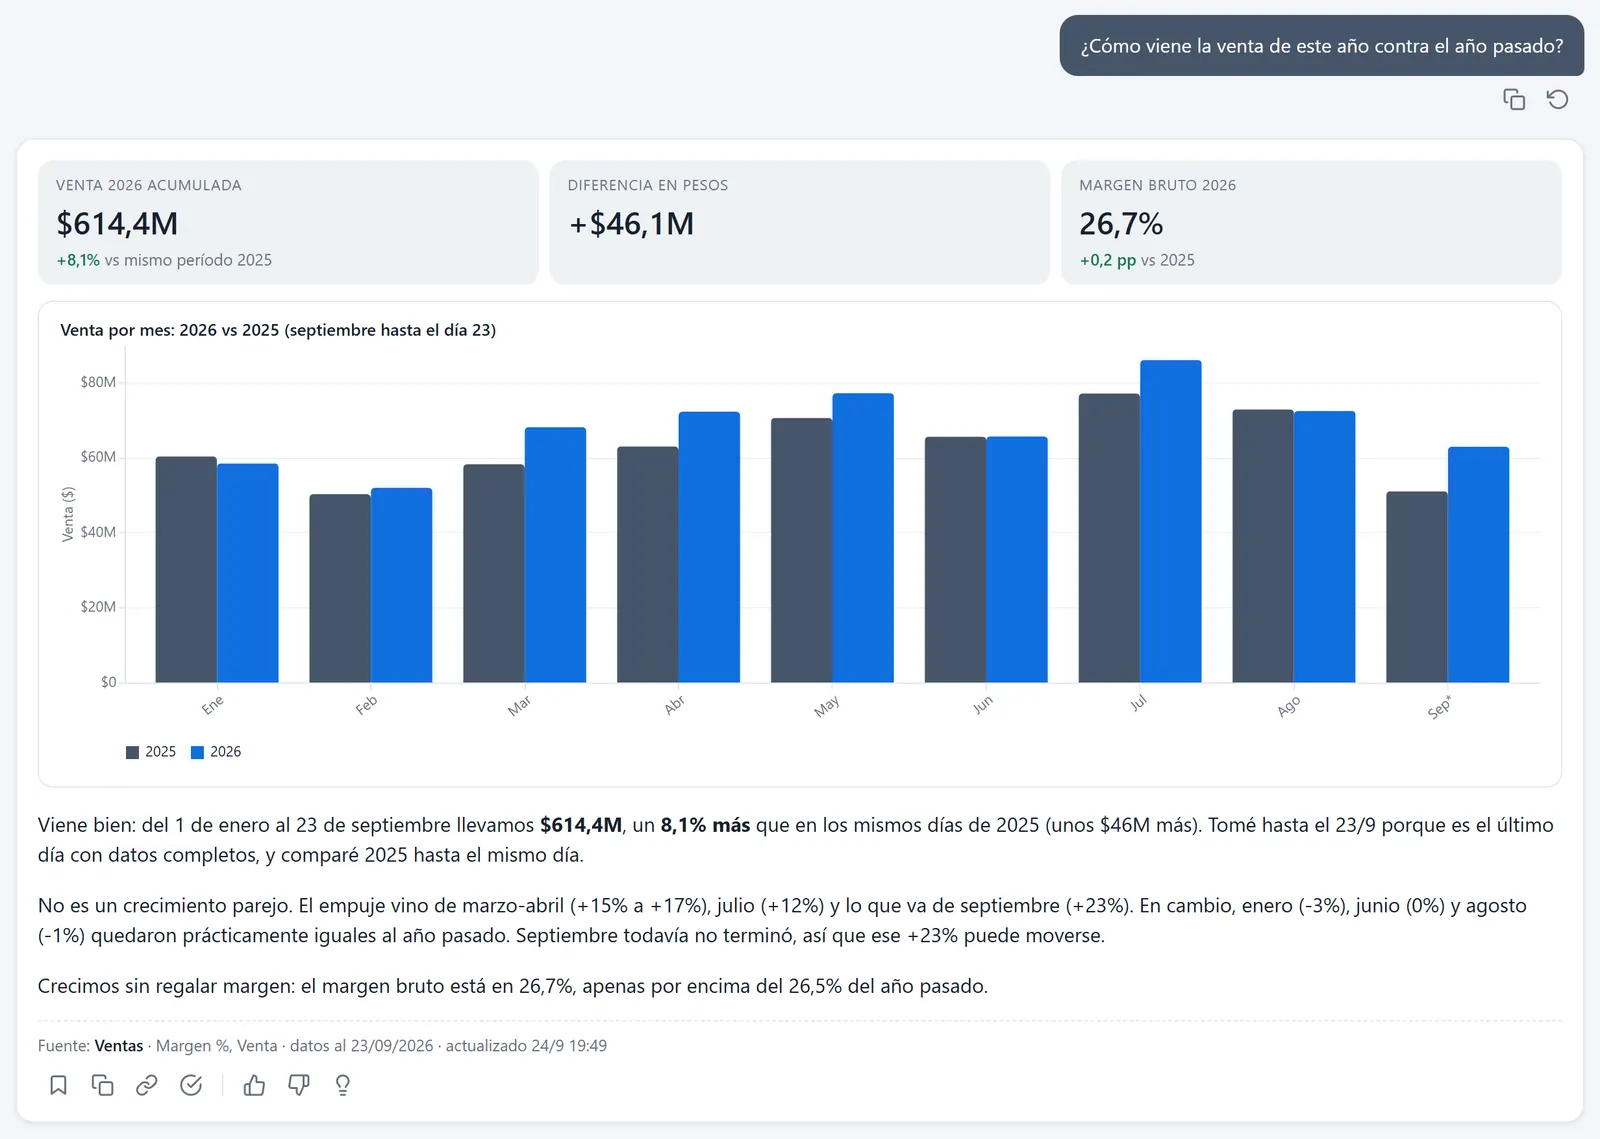
Right: +8.1%, Jan 1 to Sep 23 against the same stretch of 2025. Against all of 2025 it shows a drop that is not there.
Same questions · same data
We asked SmartBI IQ, Claude Desktop with the Power BI MCP, the Fabric Data Agent and Power BI Copilot what a director asks in any given week. The questions were put in Spanish, and the screenshots are untranslated: these are the answers, exactly as they came out.
All twenty right, with charts and always saying what period it is talking about.
Four more halfway. The same brain as IQ, with an analyst driving it.
Four more halfway. Set up with the same glossary and the same rules as IQ.
Two more halfway. It answers well when the answer is a single figure.
Sales and Results from a demo distributor, with sales through Sep 23 2026 and accounting closed through August.
Every correct answer was worked out by hand, with our own queries, before asking.
The Data Agent has the same glossary and the same business rules as IQ. Claude Desktop got the MCP and nothing else: just the model, the way an analyst uses it. Tested on Oct 11 2026.
The everyday ones
Tap any screenshot to see it full size.
Right: +8.1%, Jan 1 to Sep 23 against the same stretch of 2025. Against all of 2025 it shows a drop that is not there.
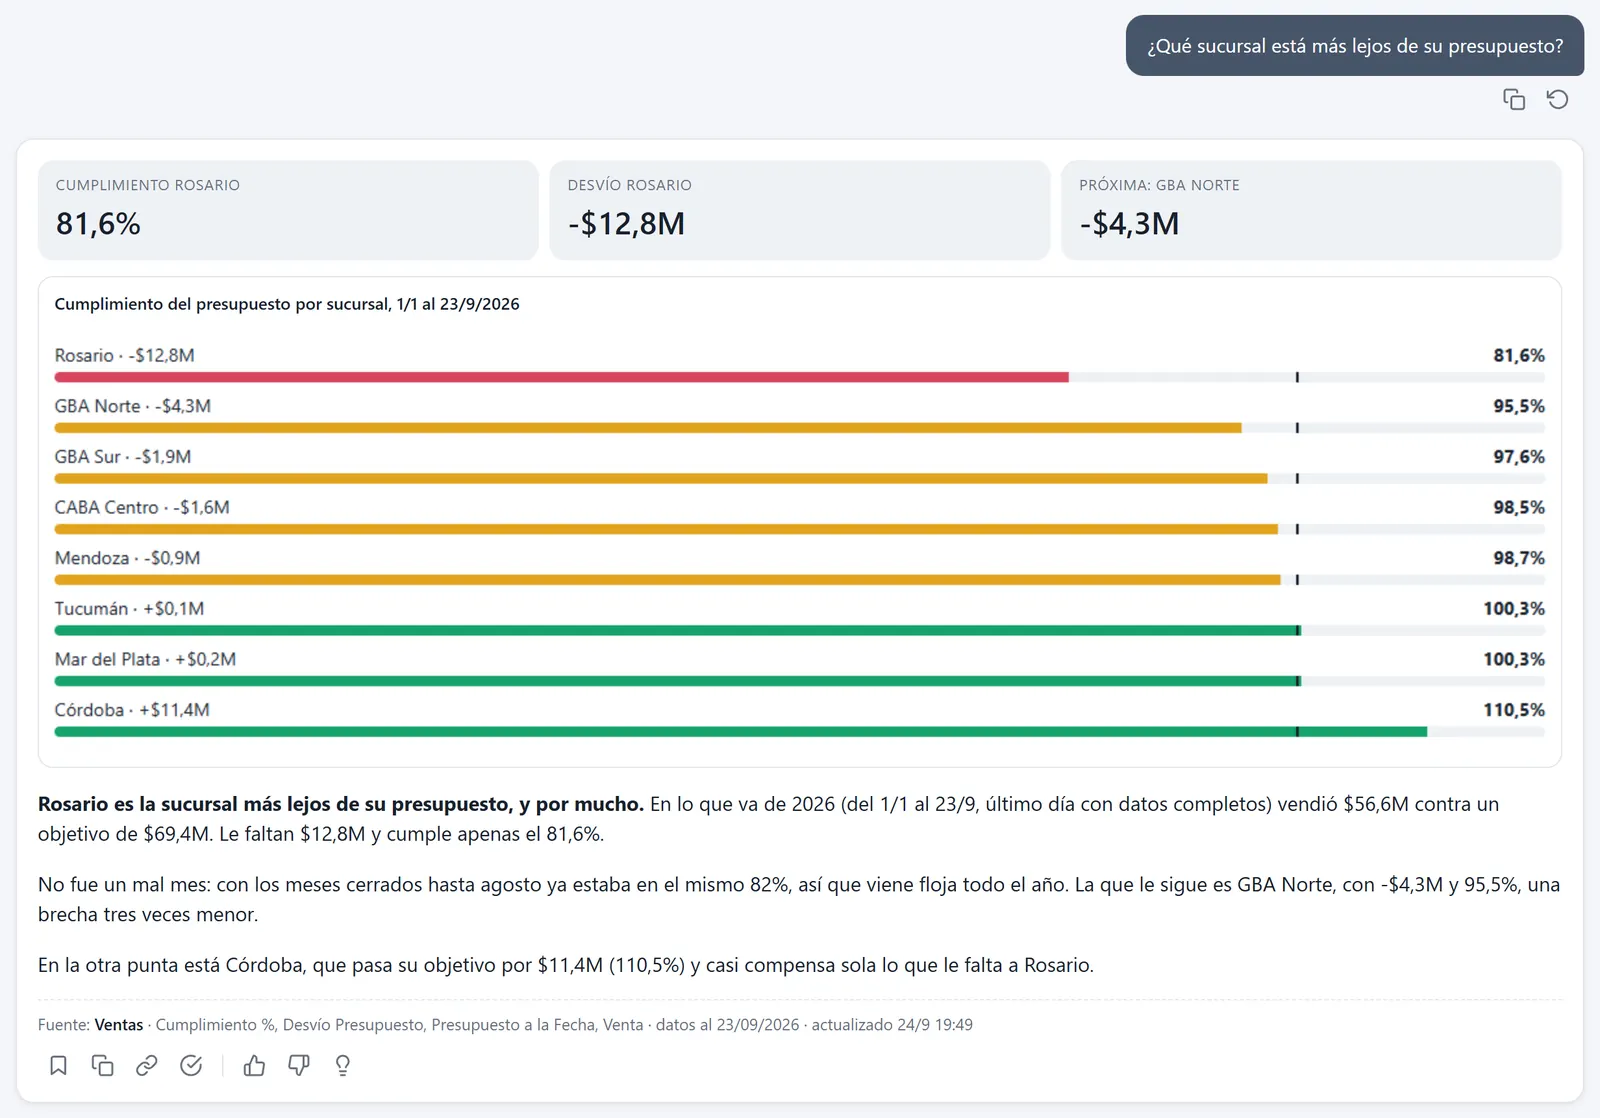
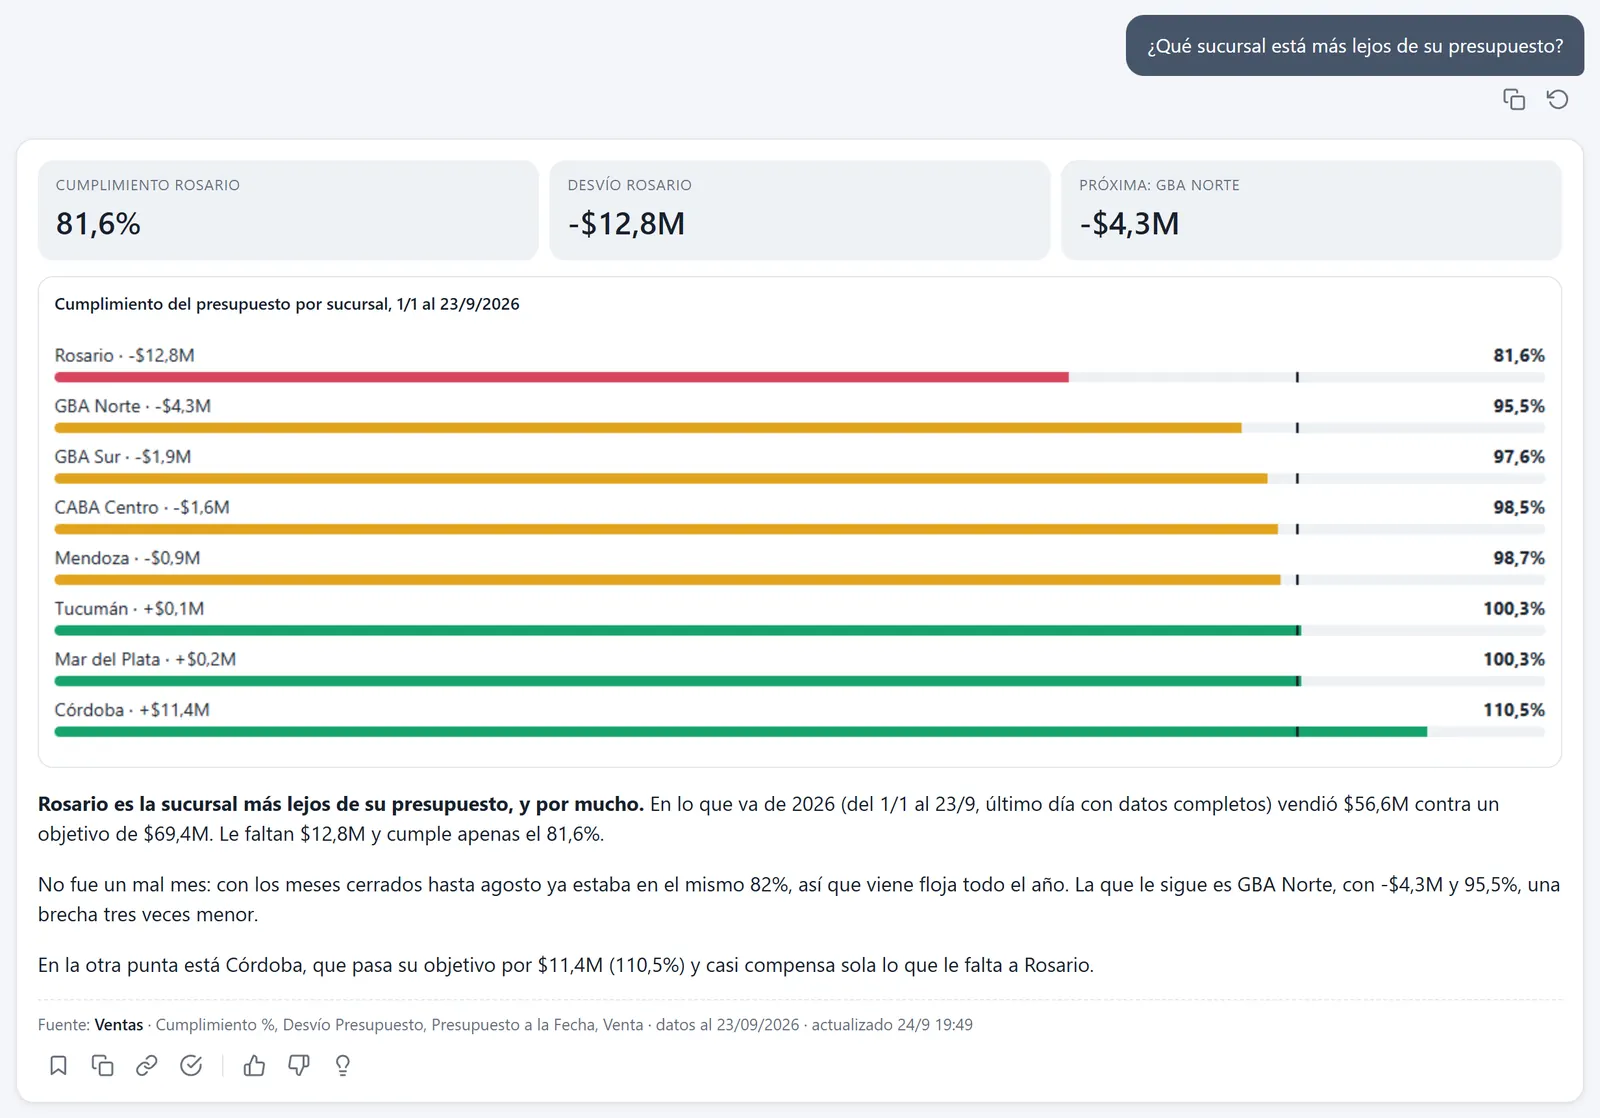
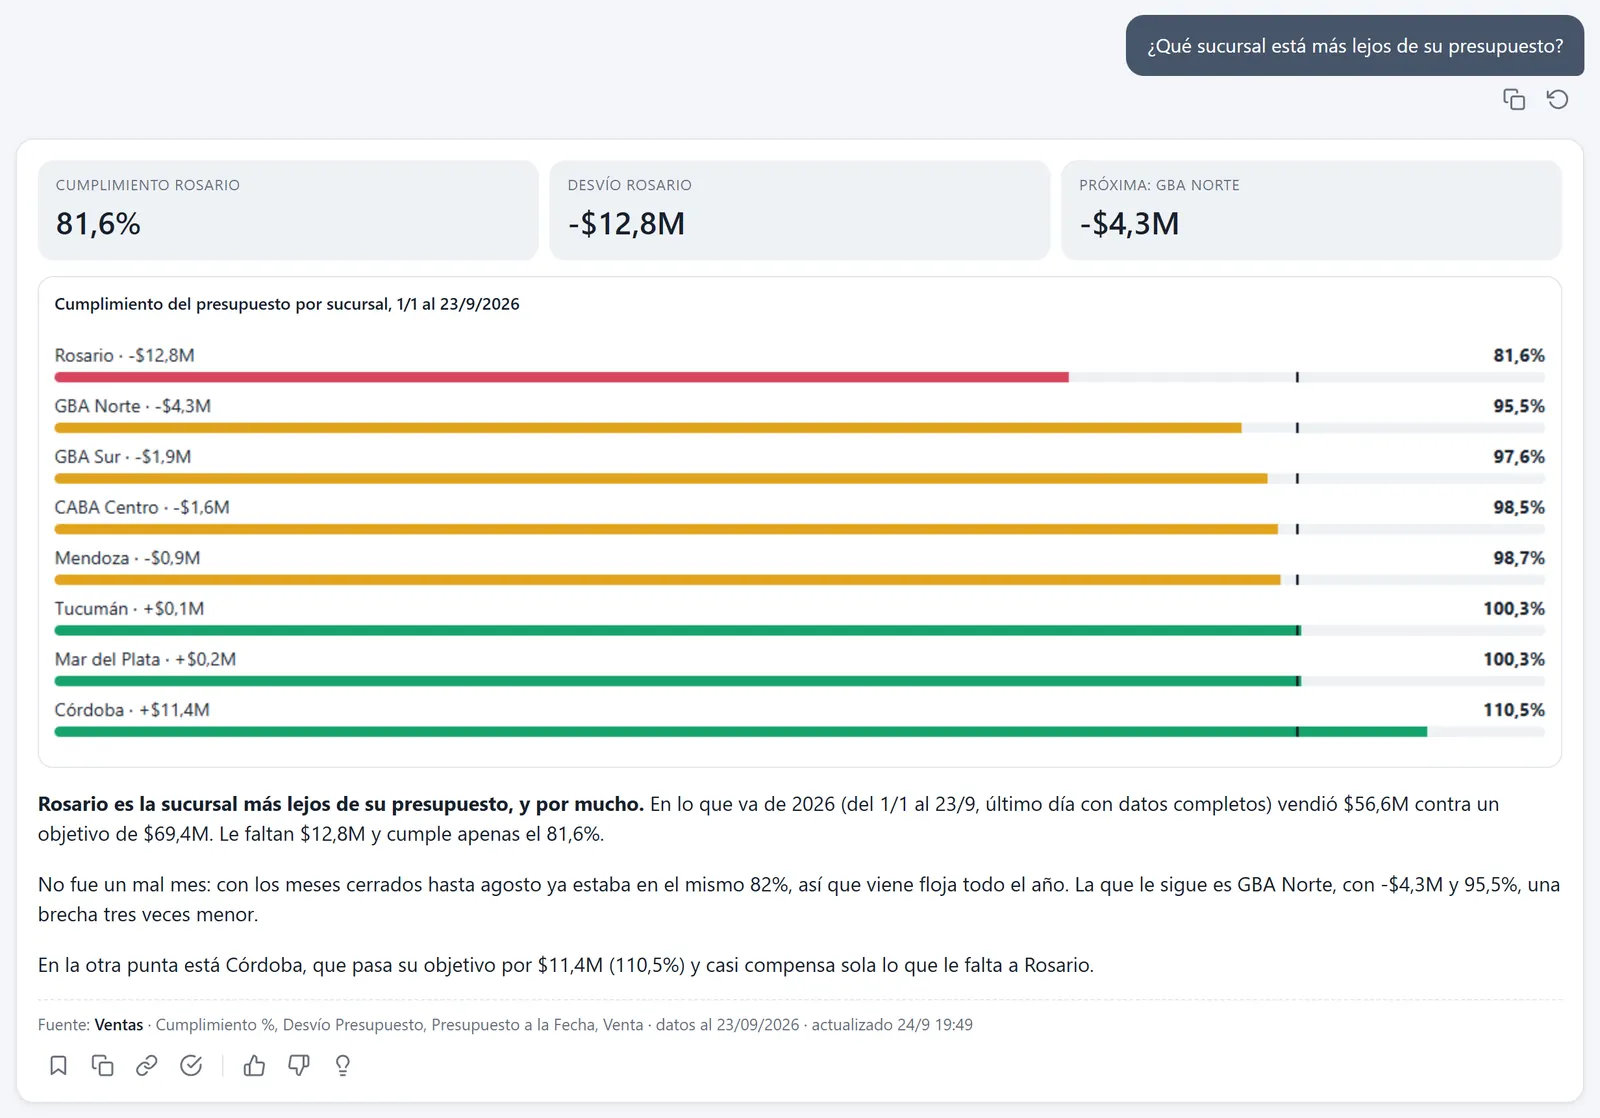
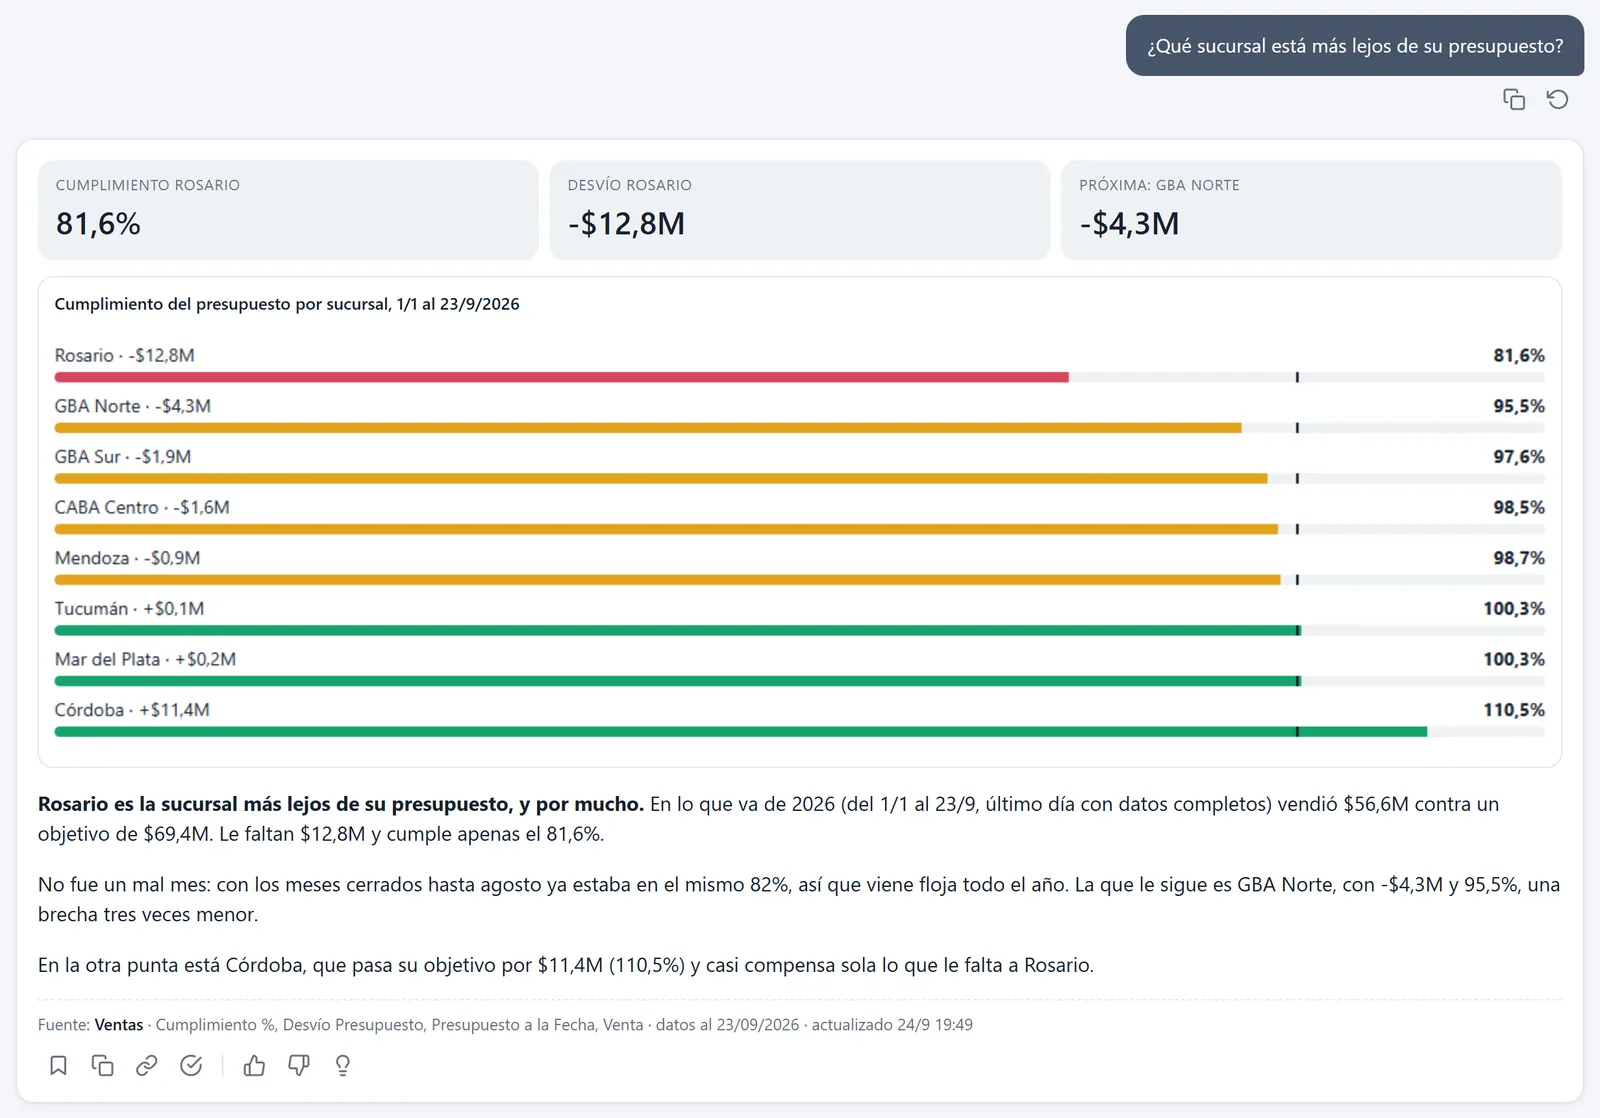
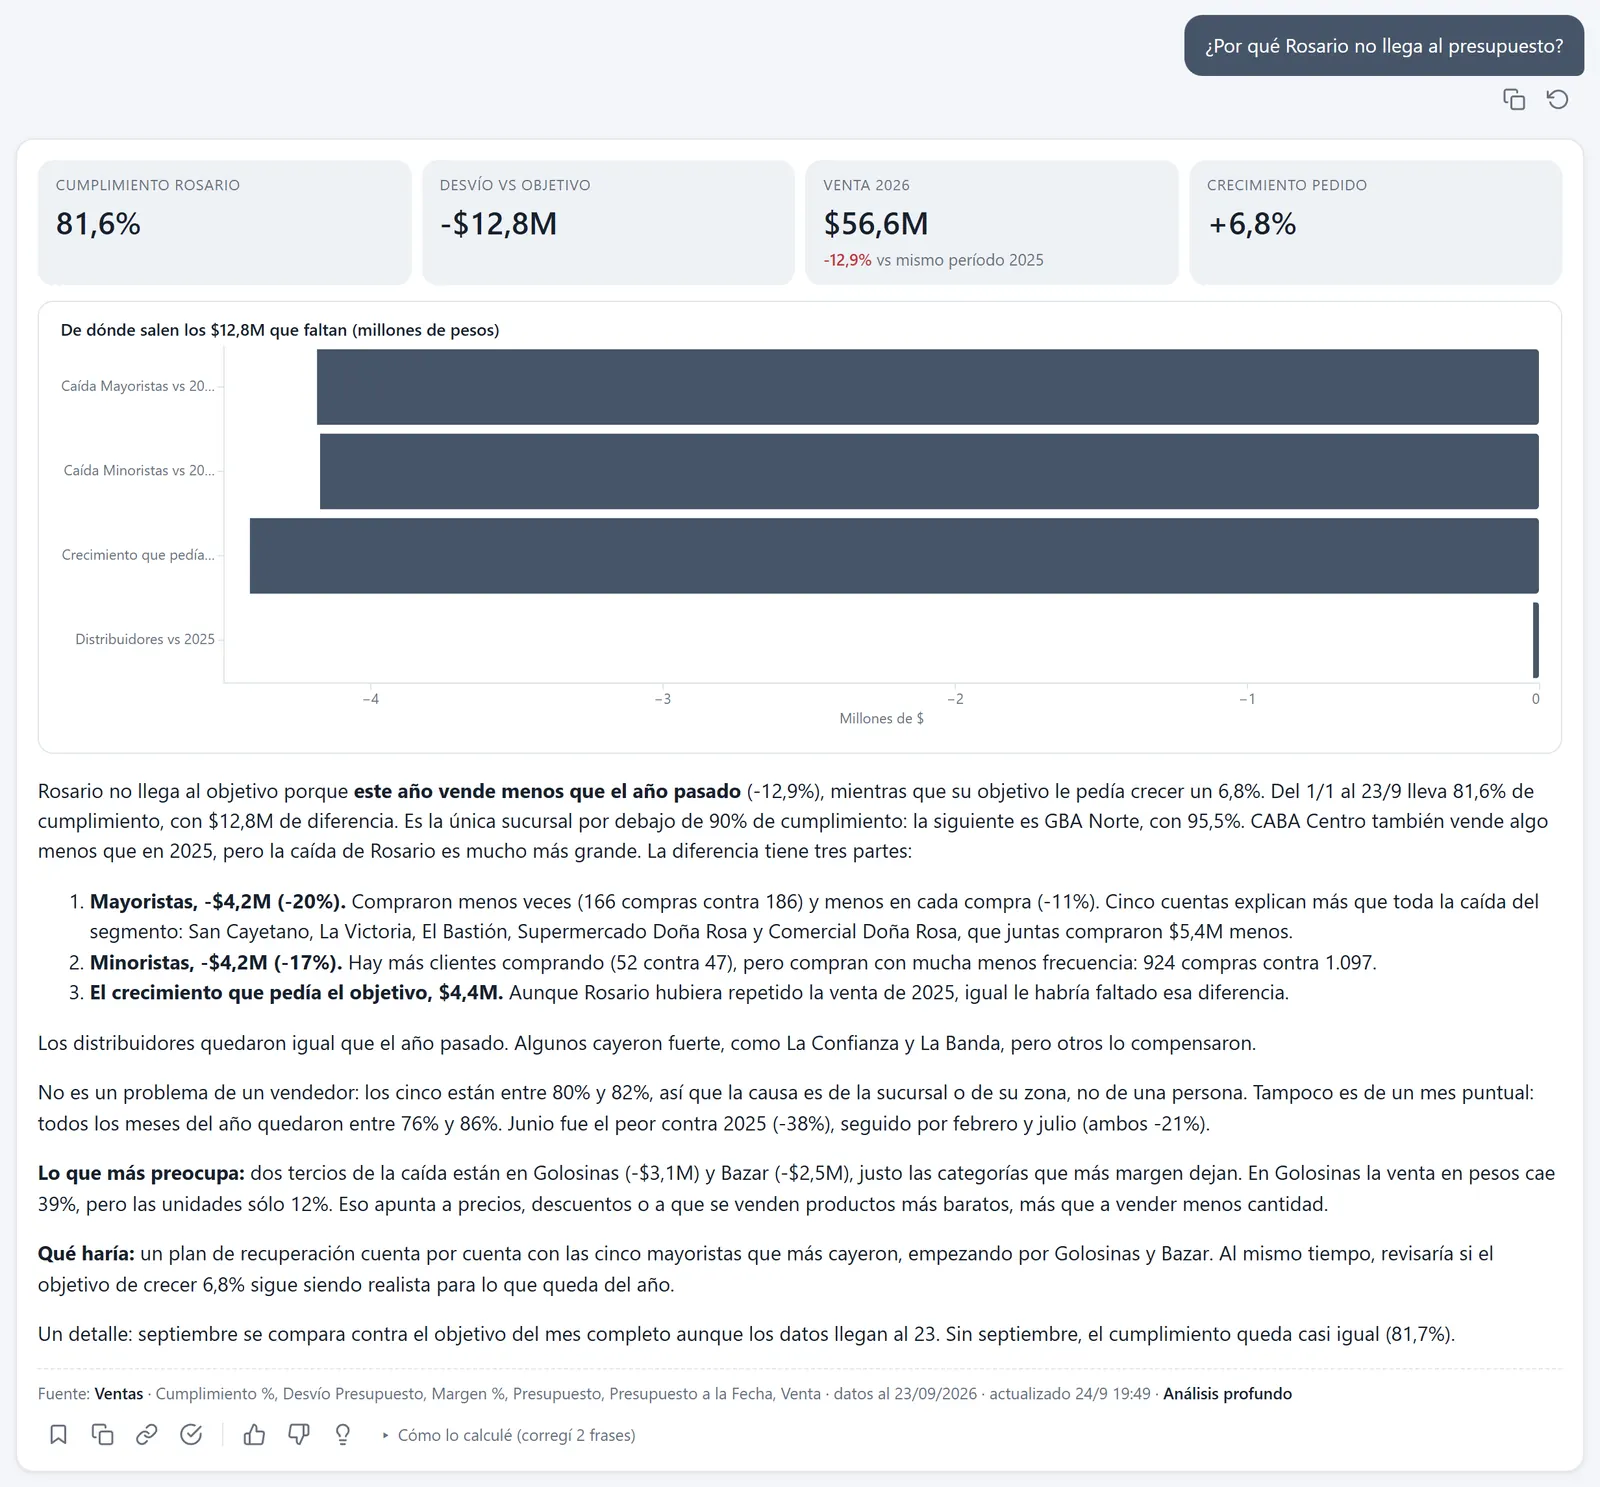
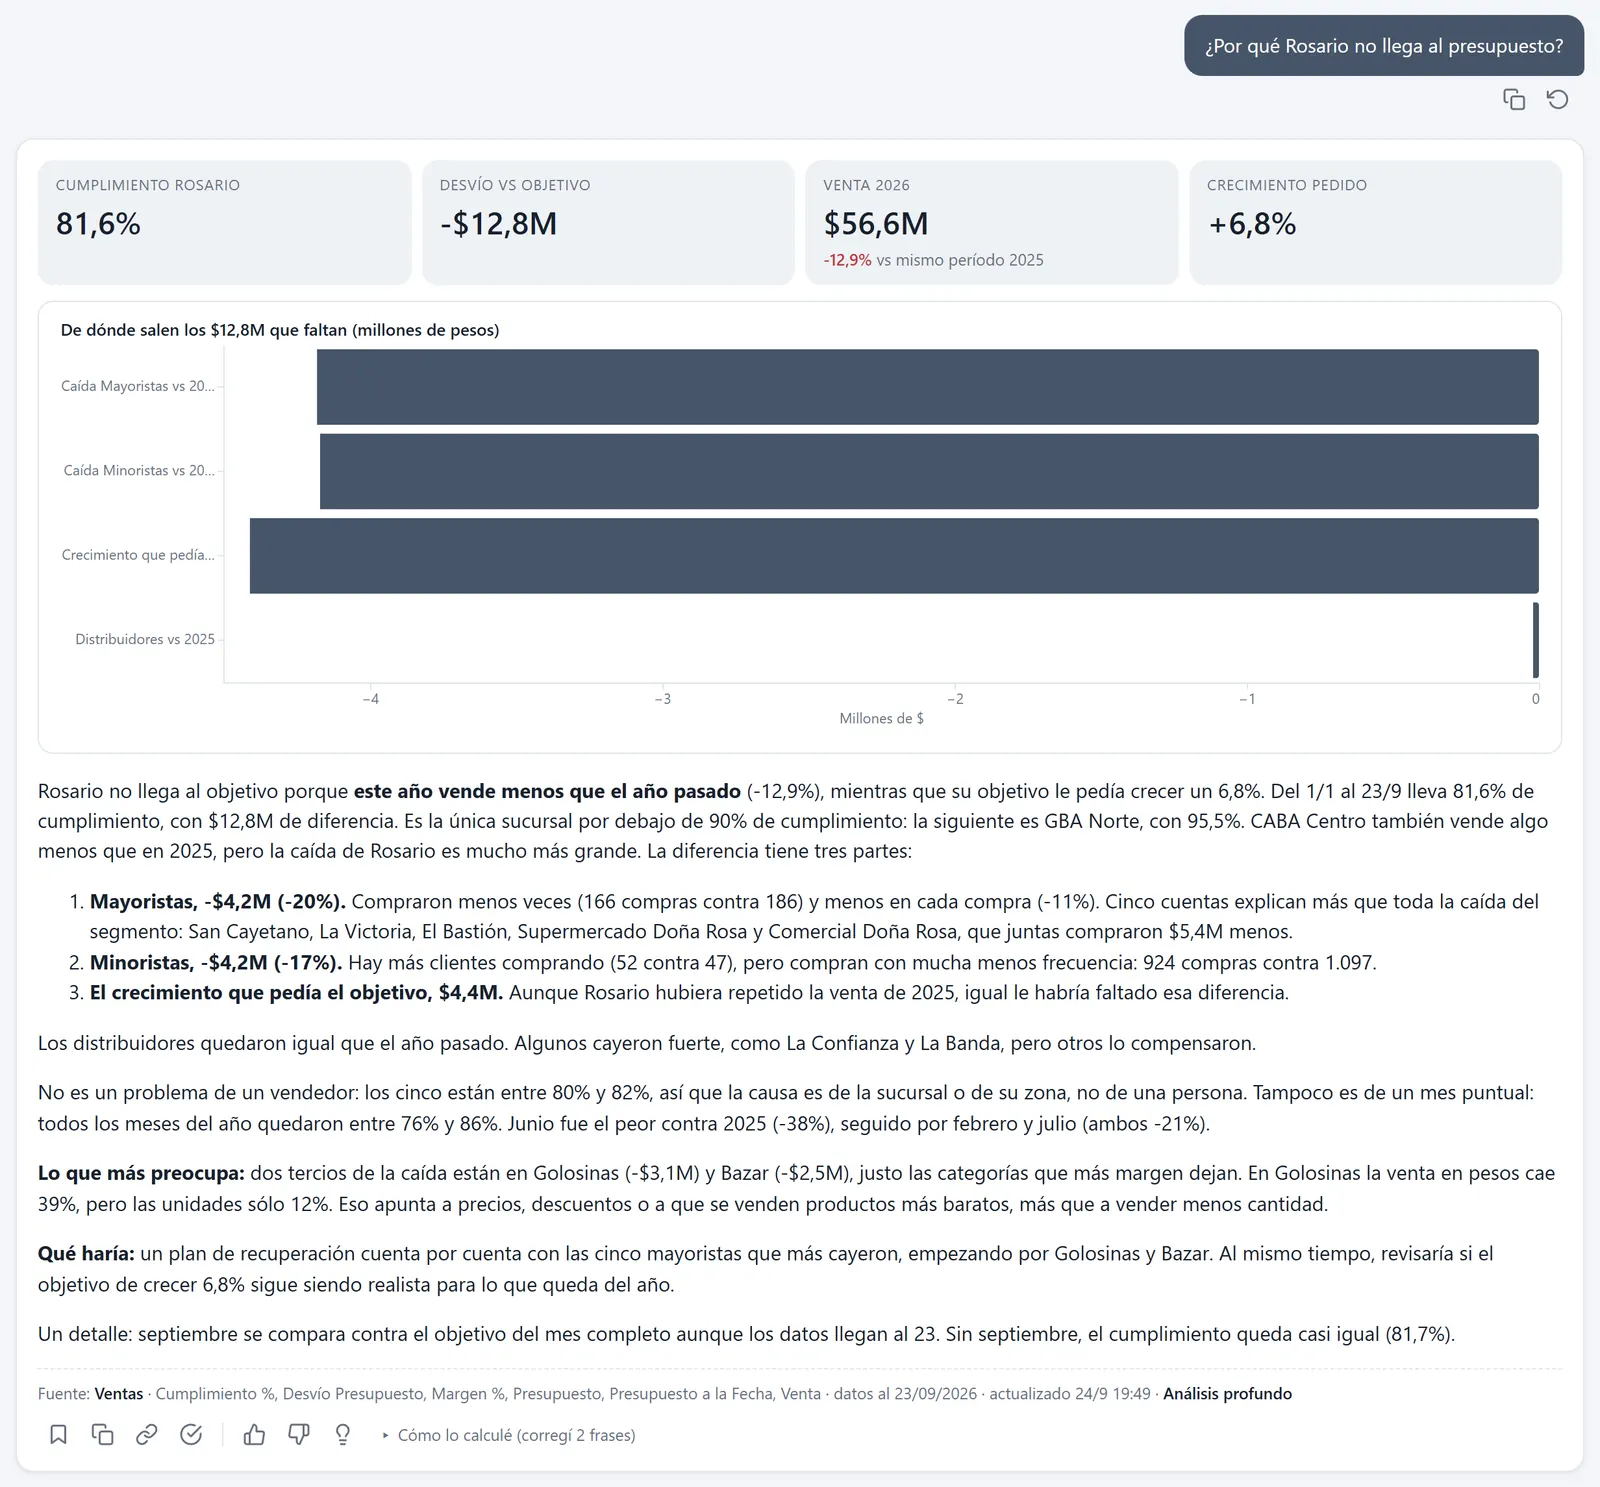
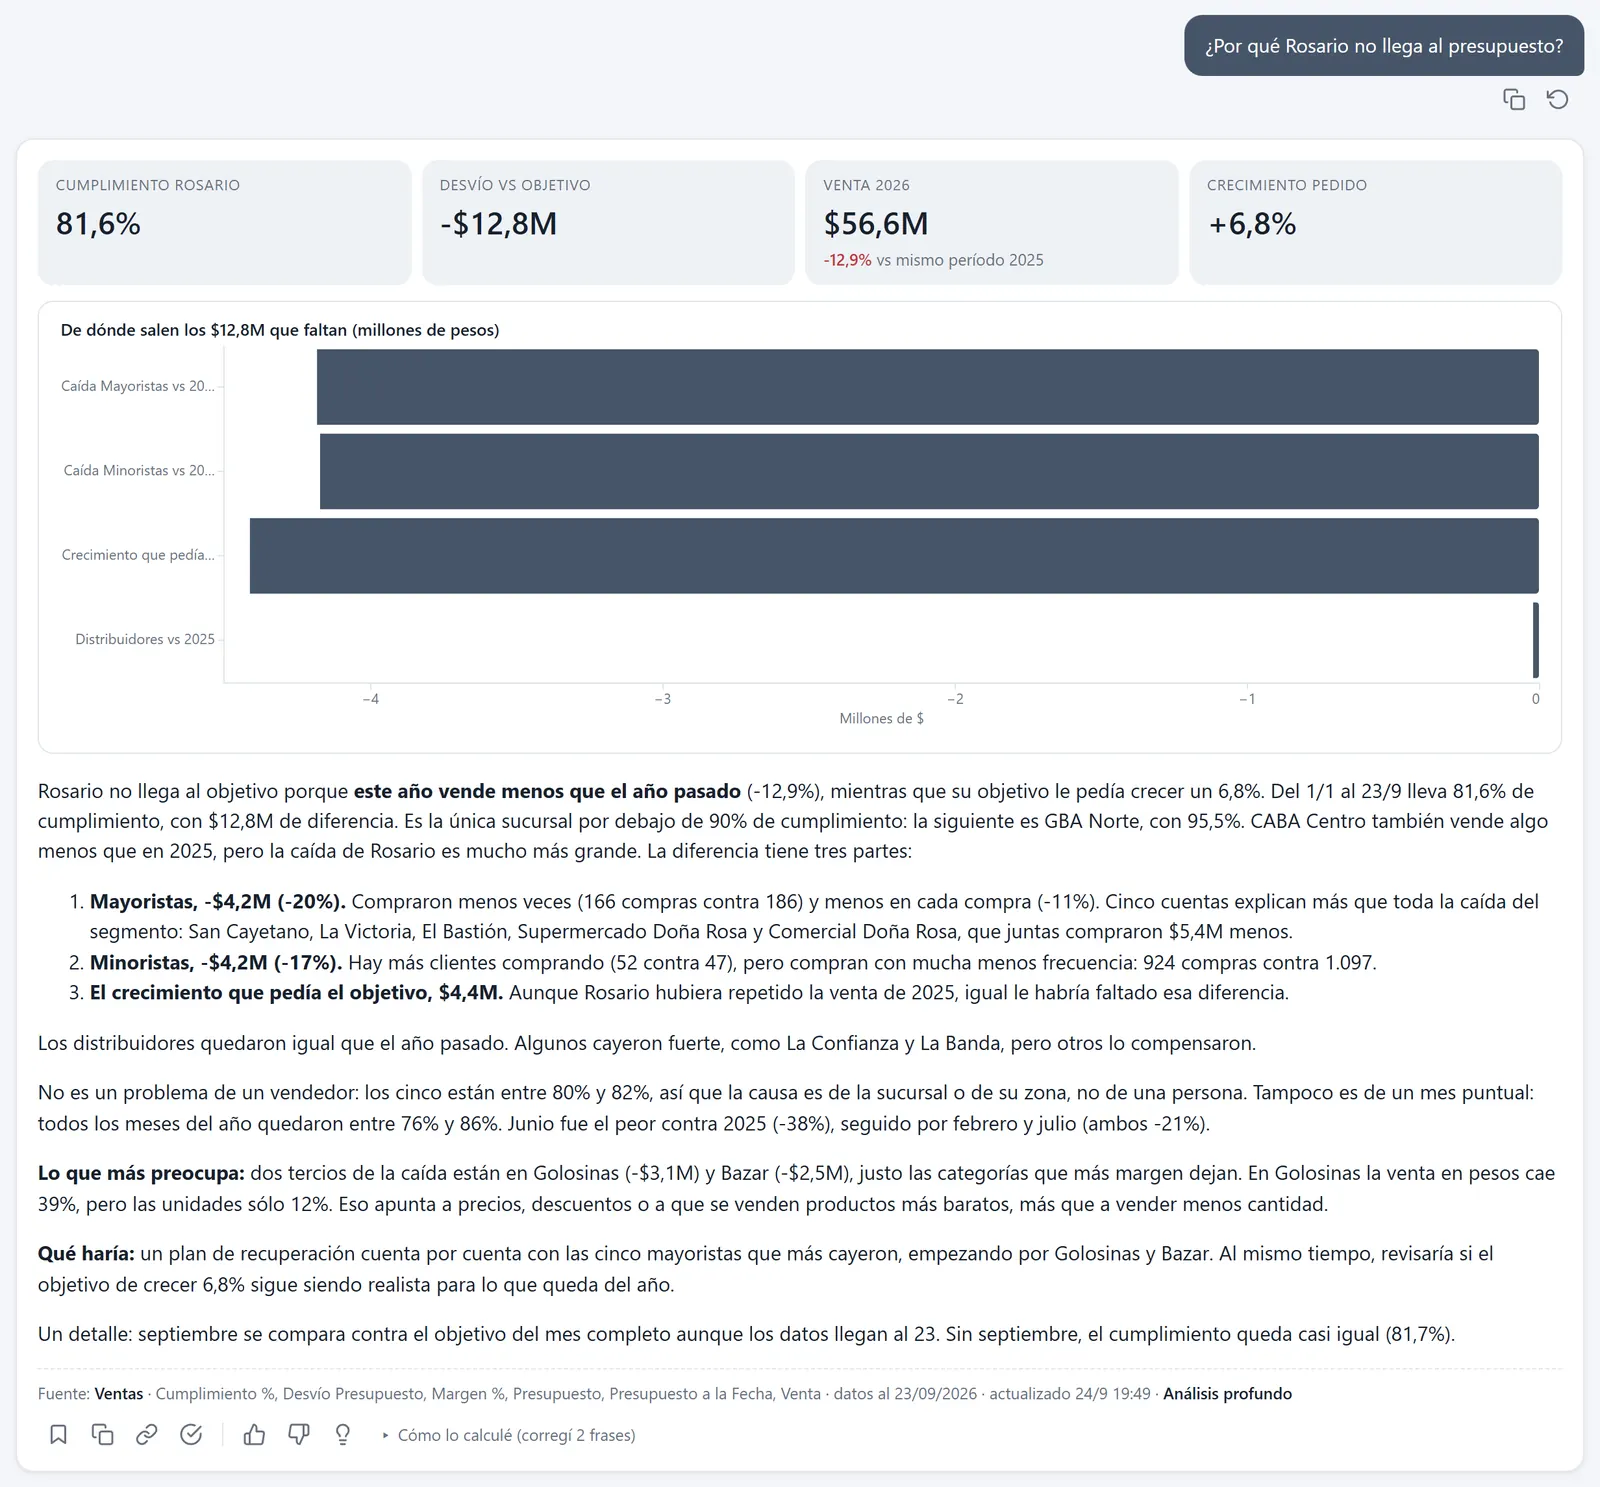
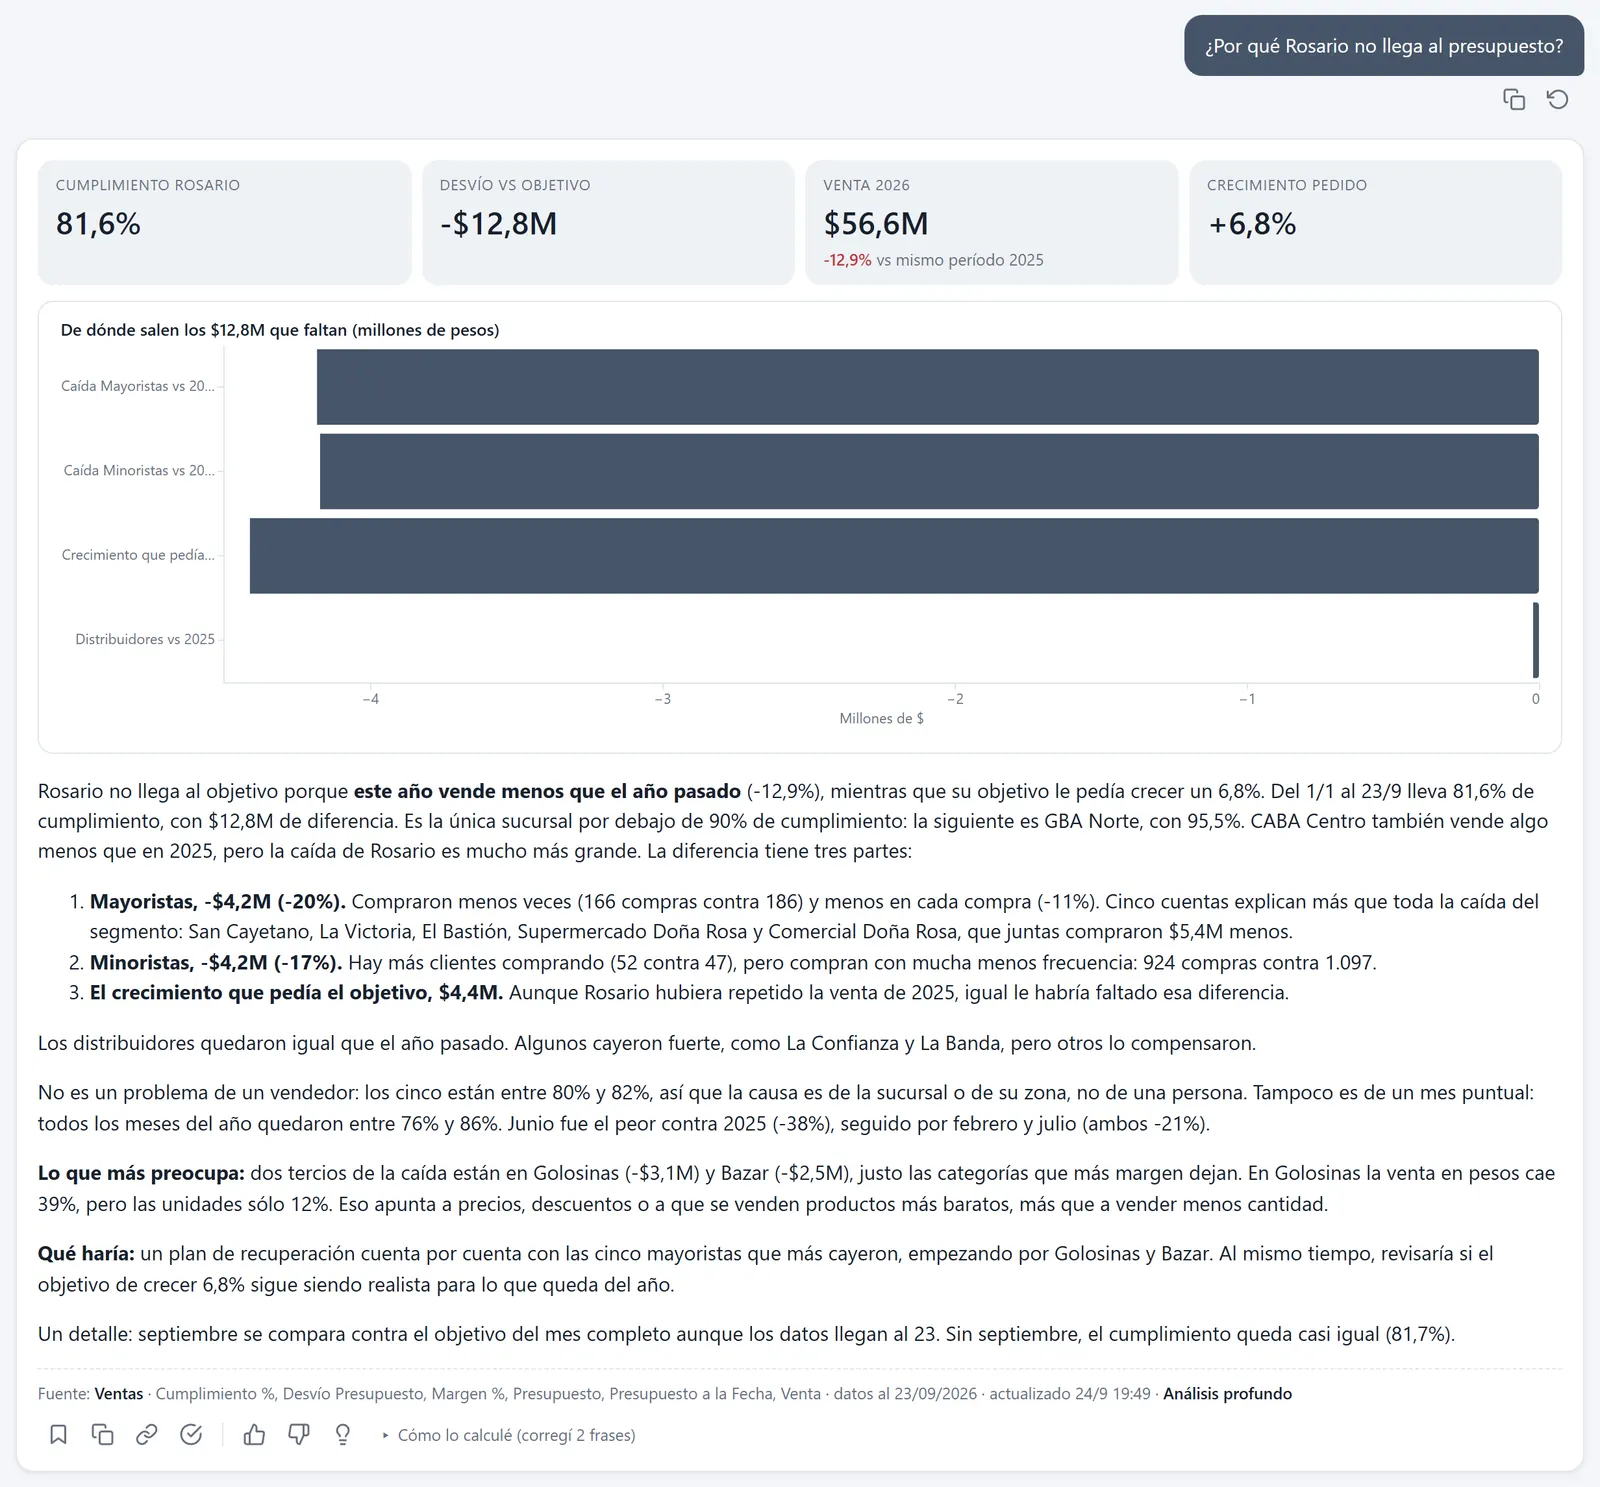
Right: Rosario, at 82% and $12.8M below.
Right: it sells 13% less than last year. Candy and Housewares are down, and customers buy less often.
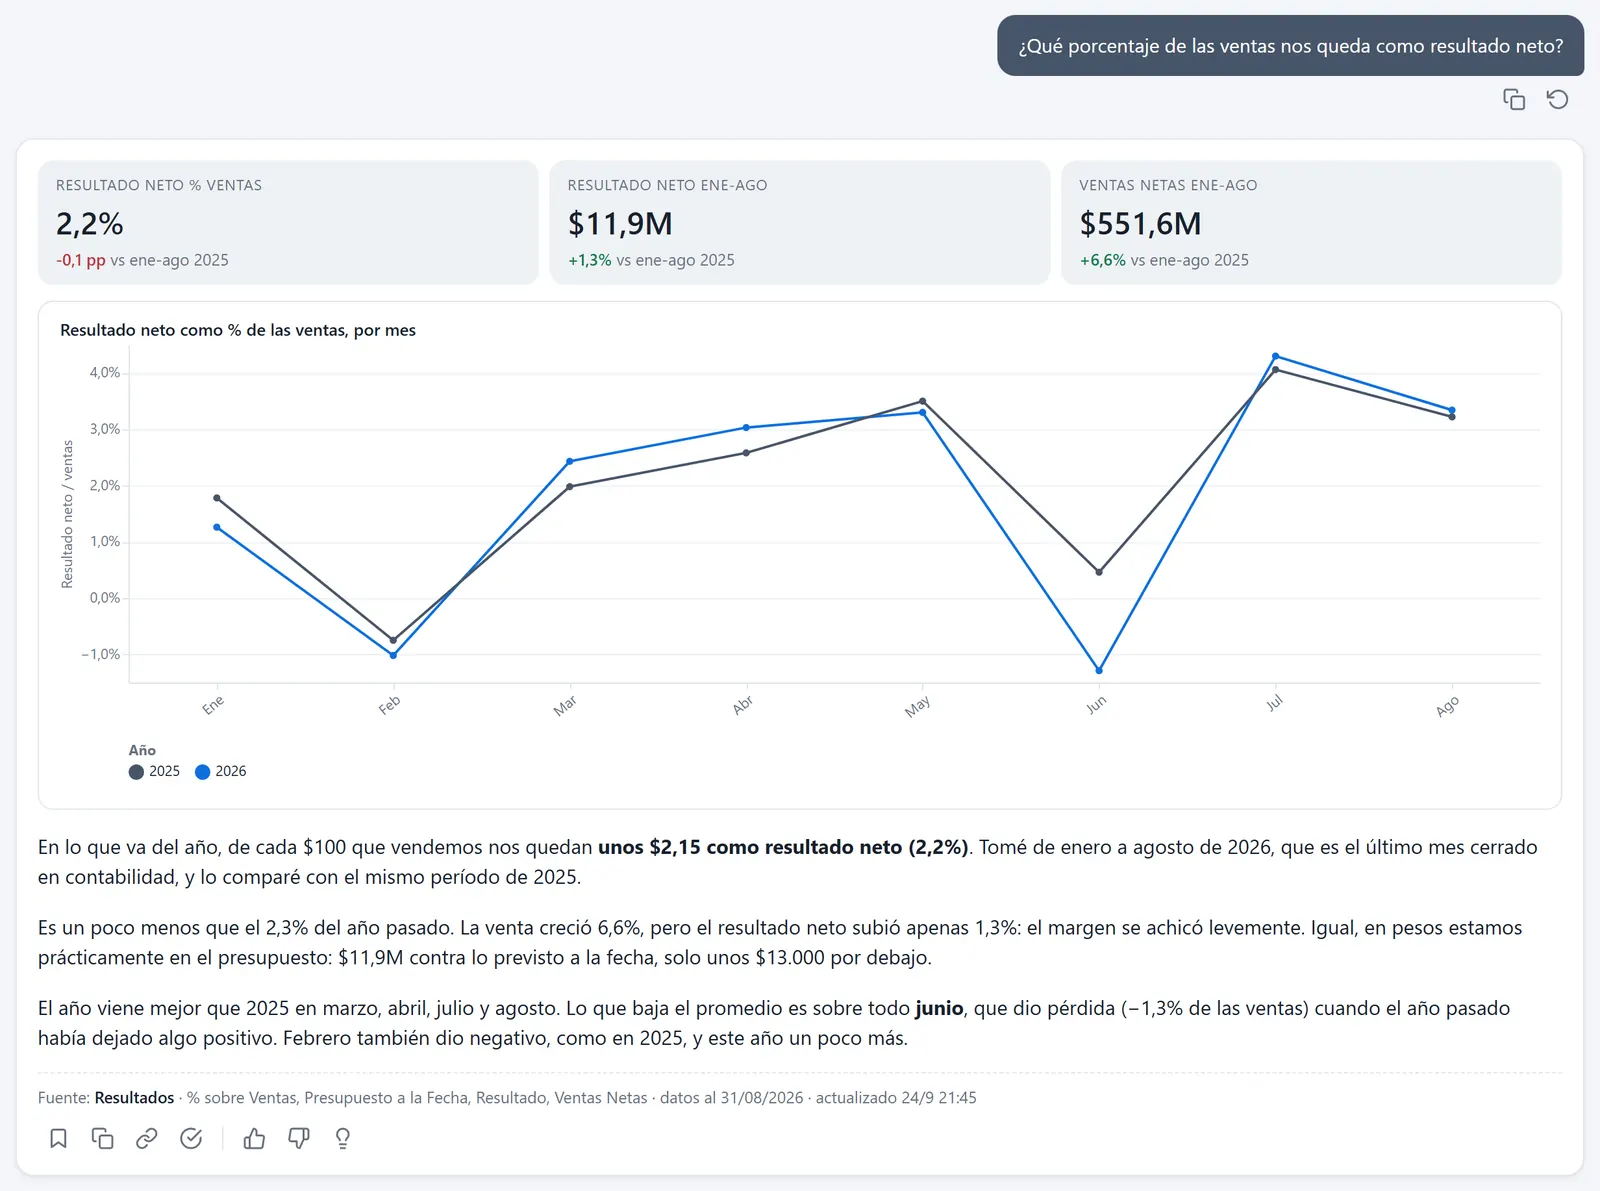
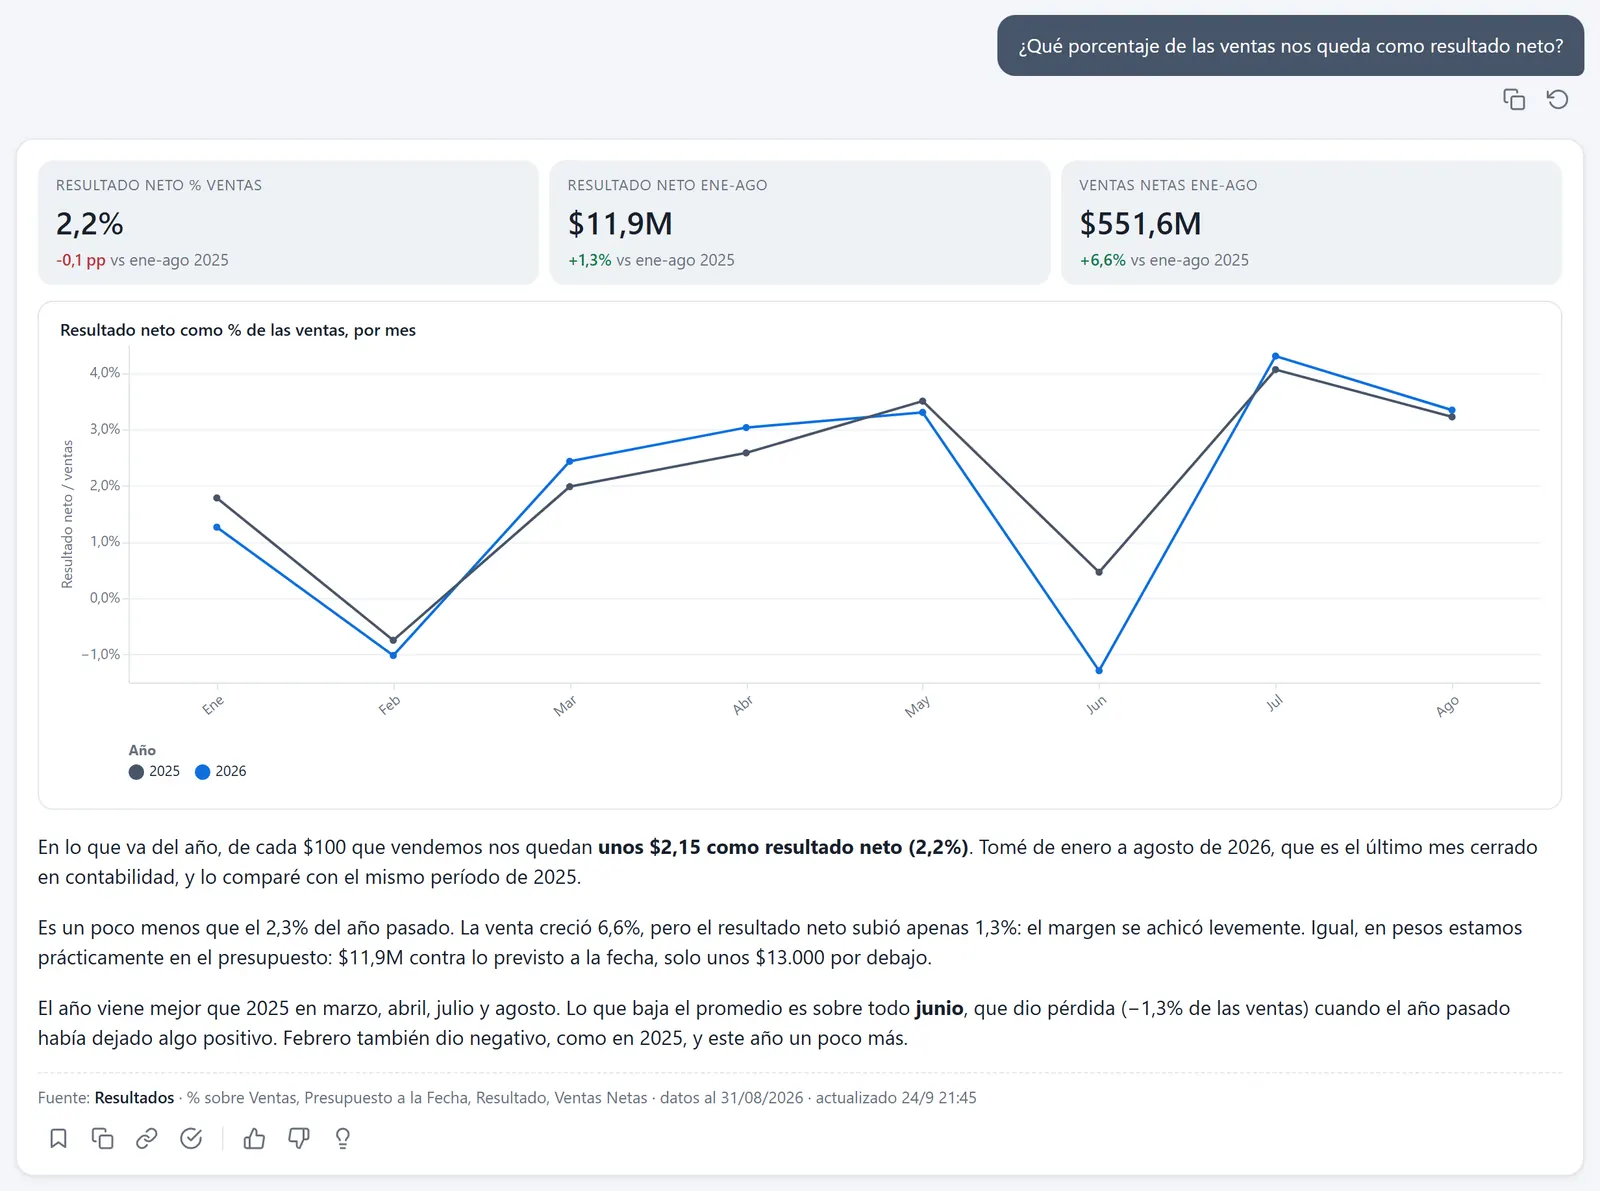
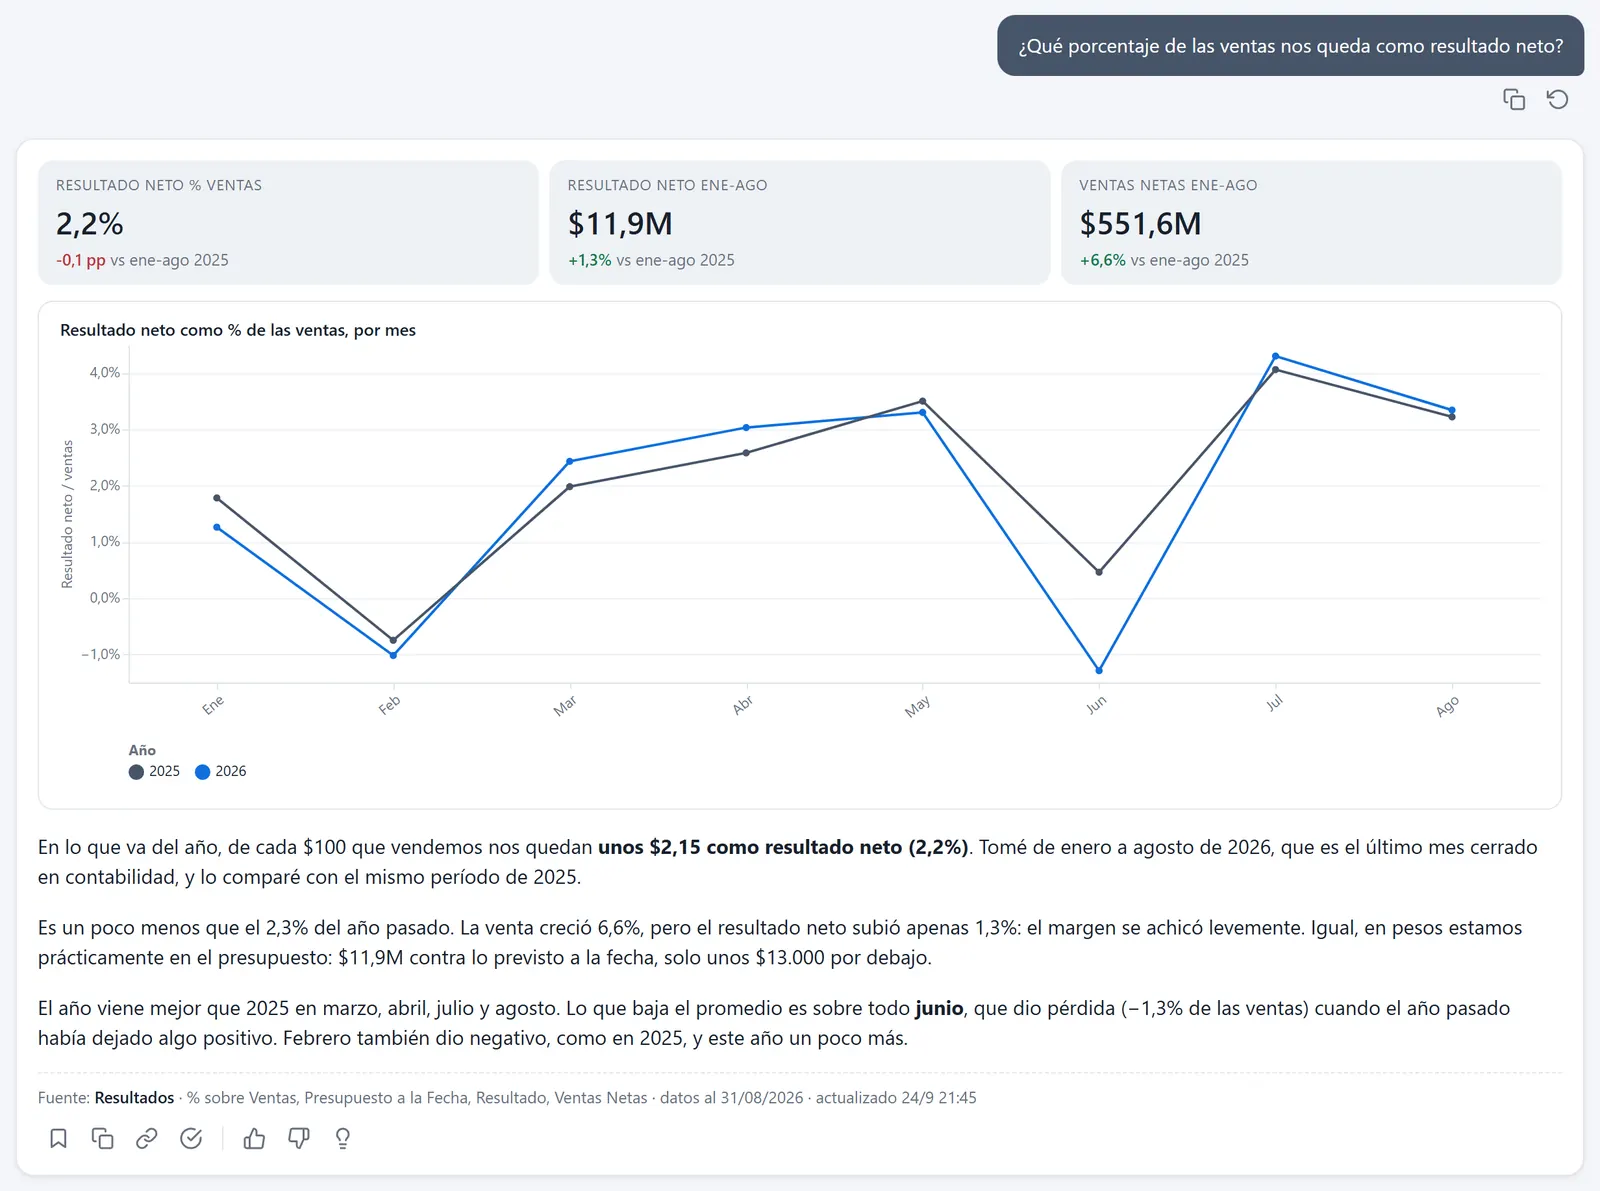
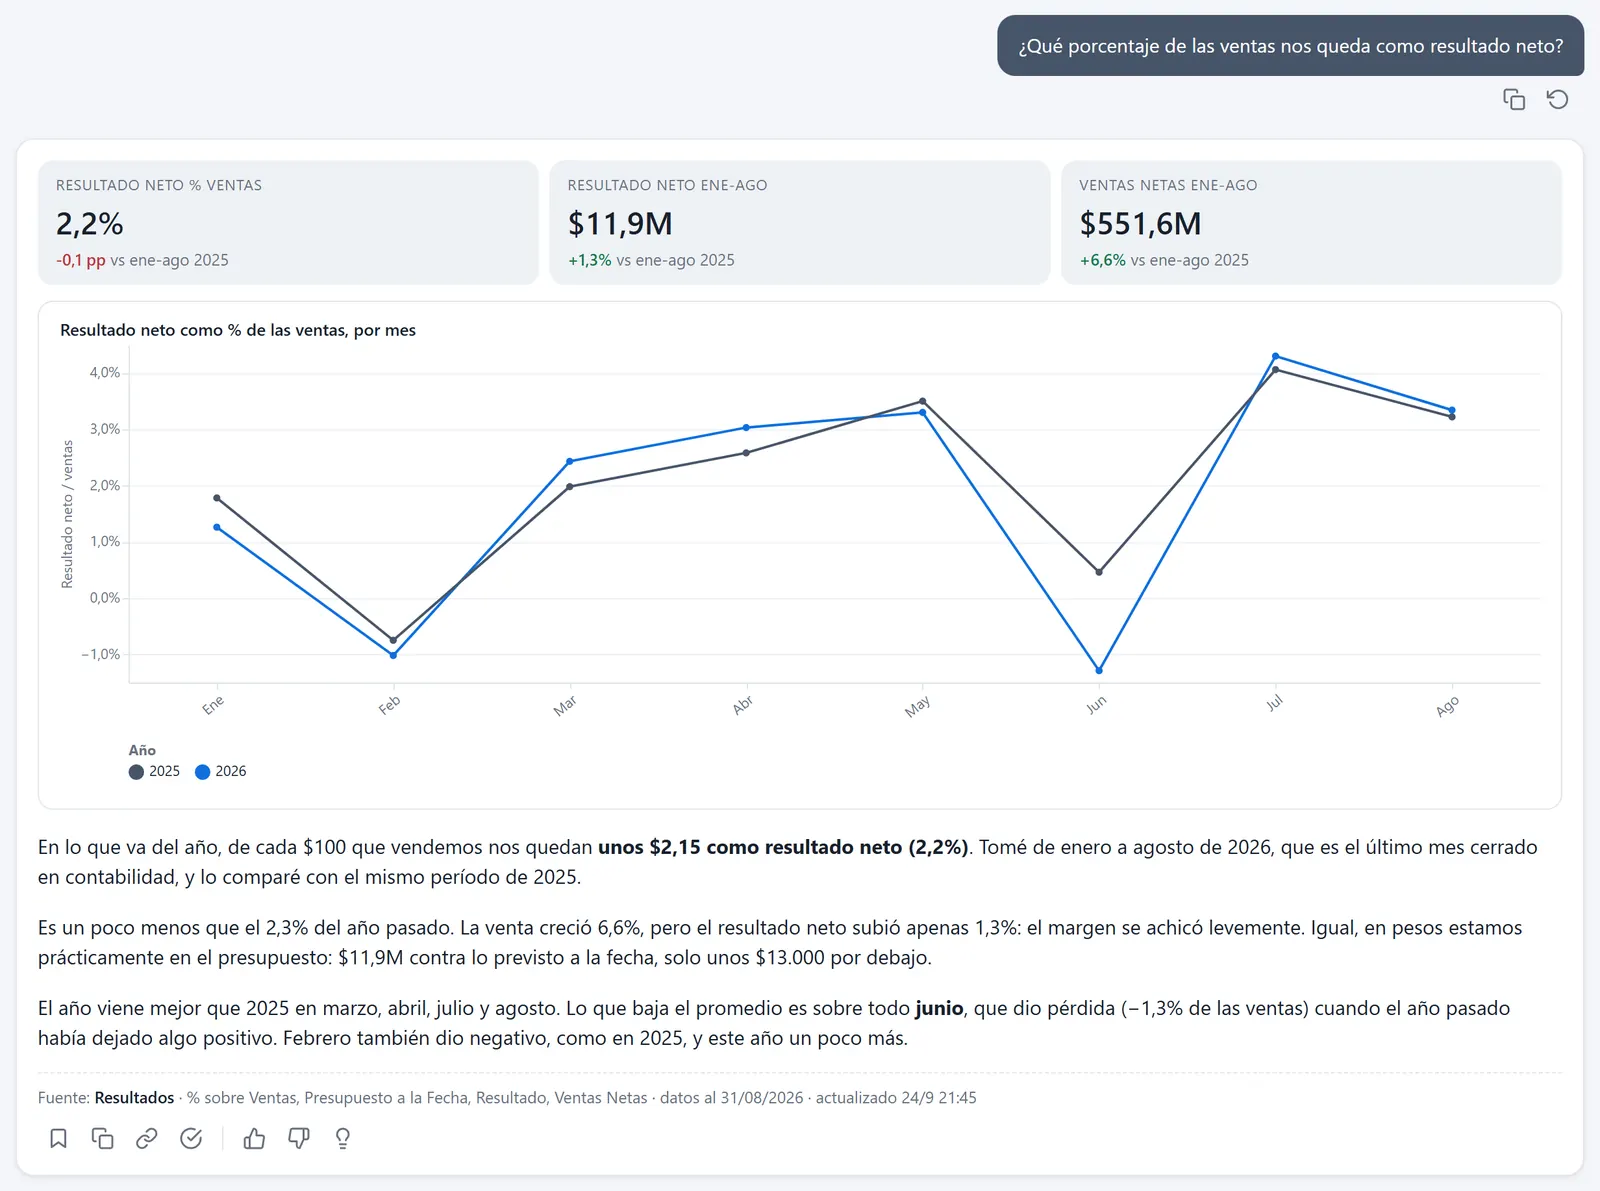
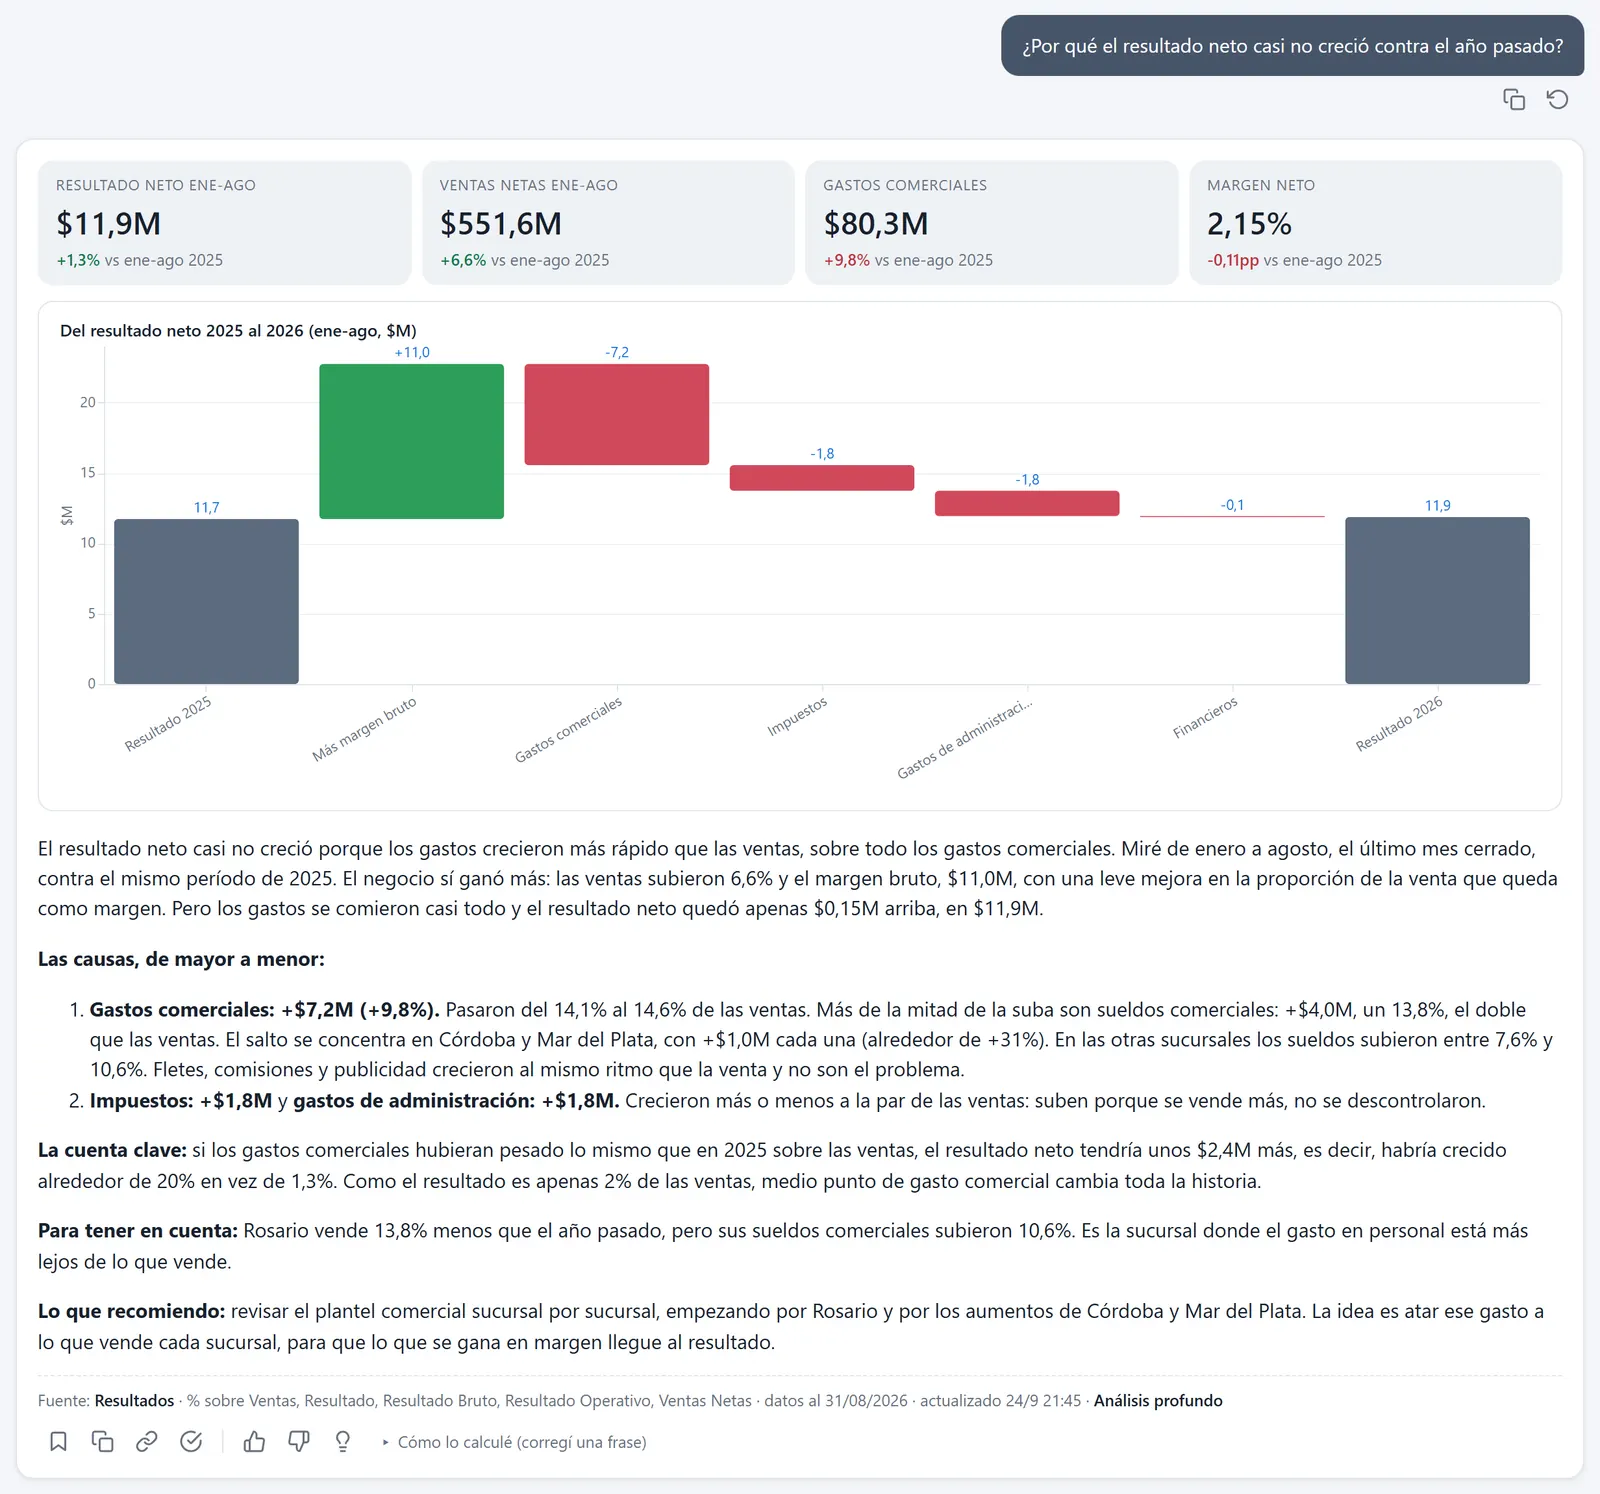
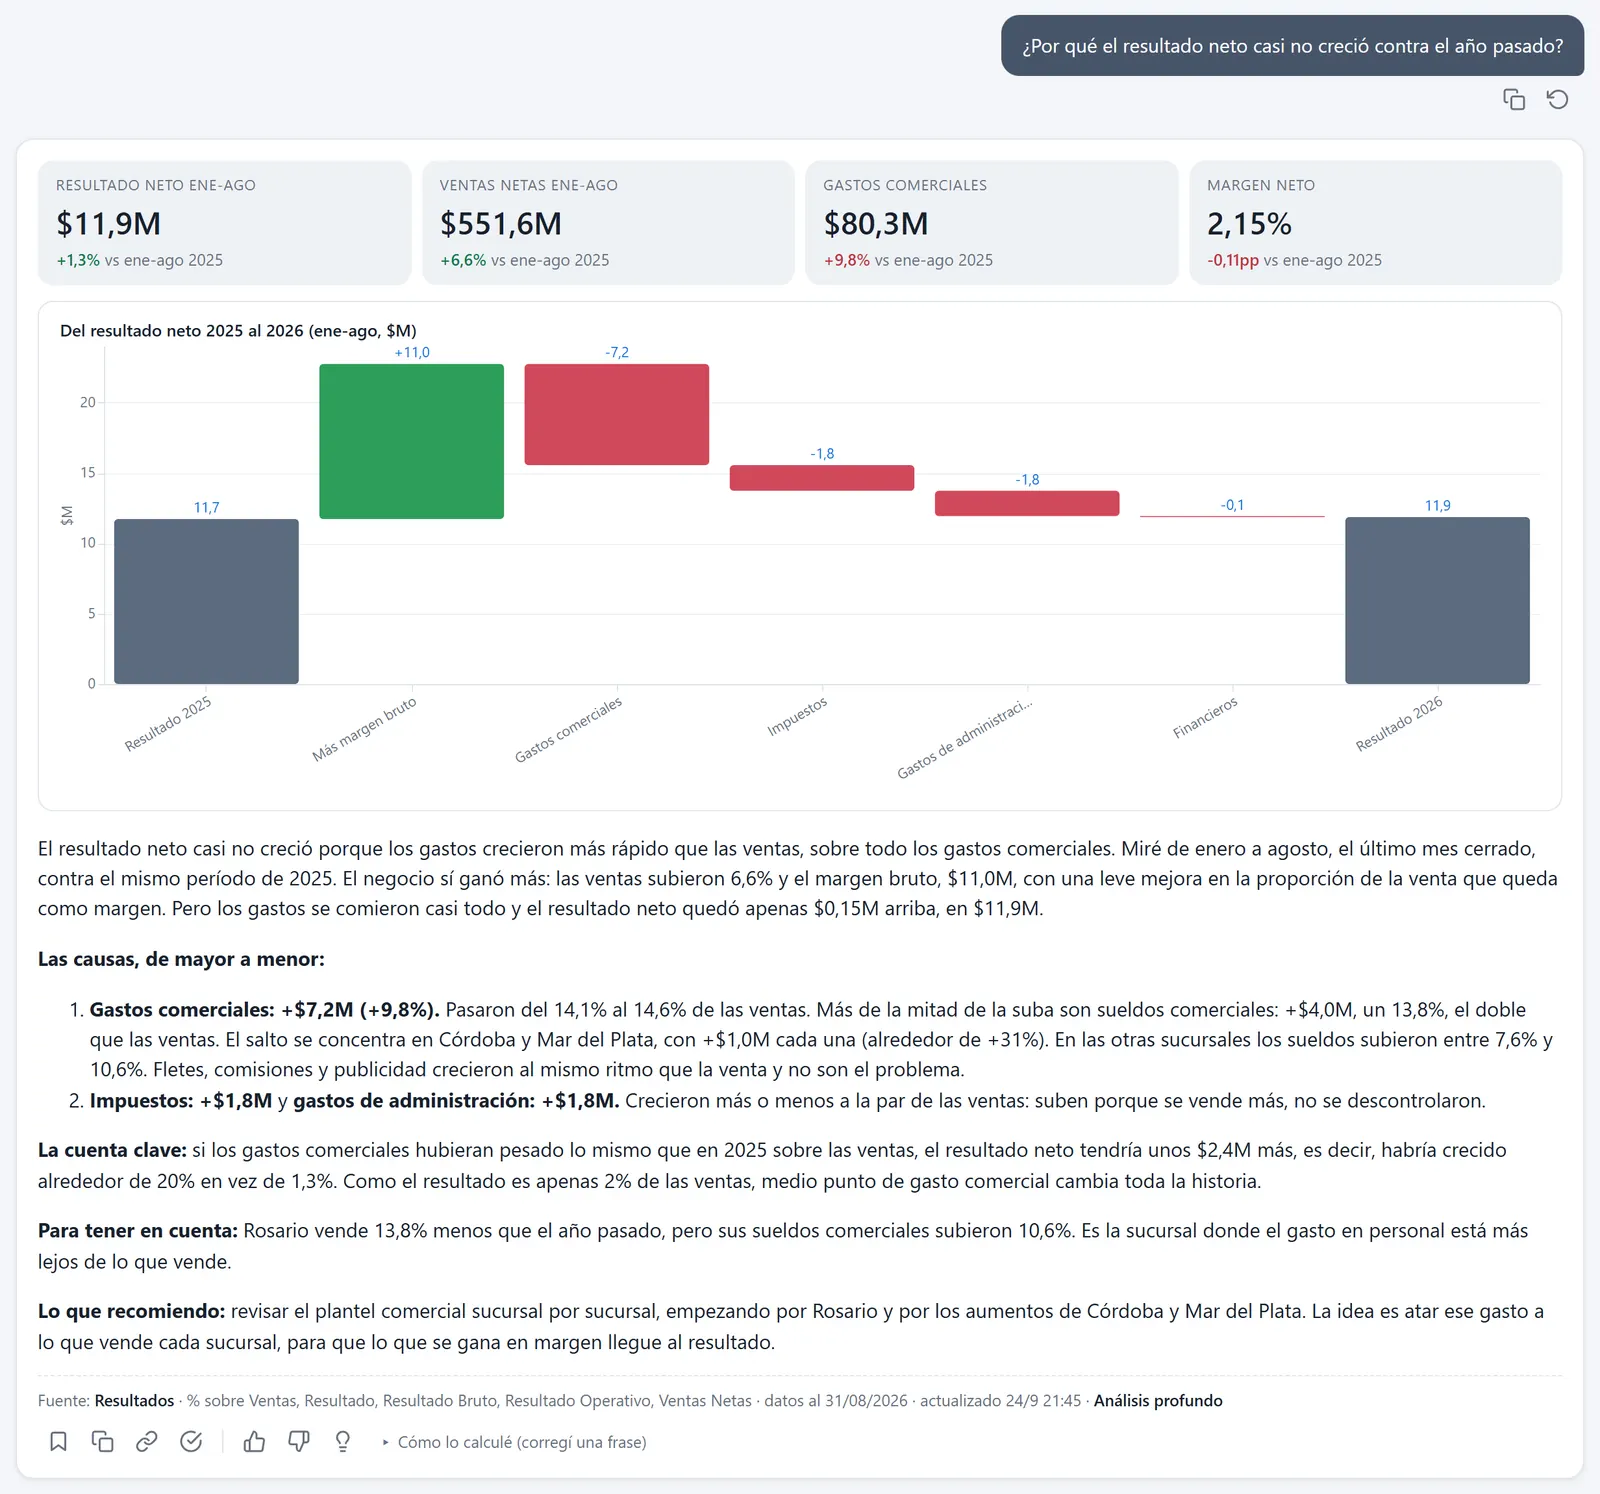
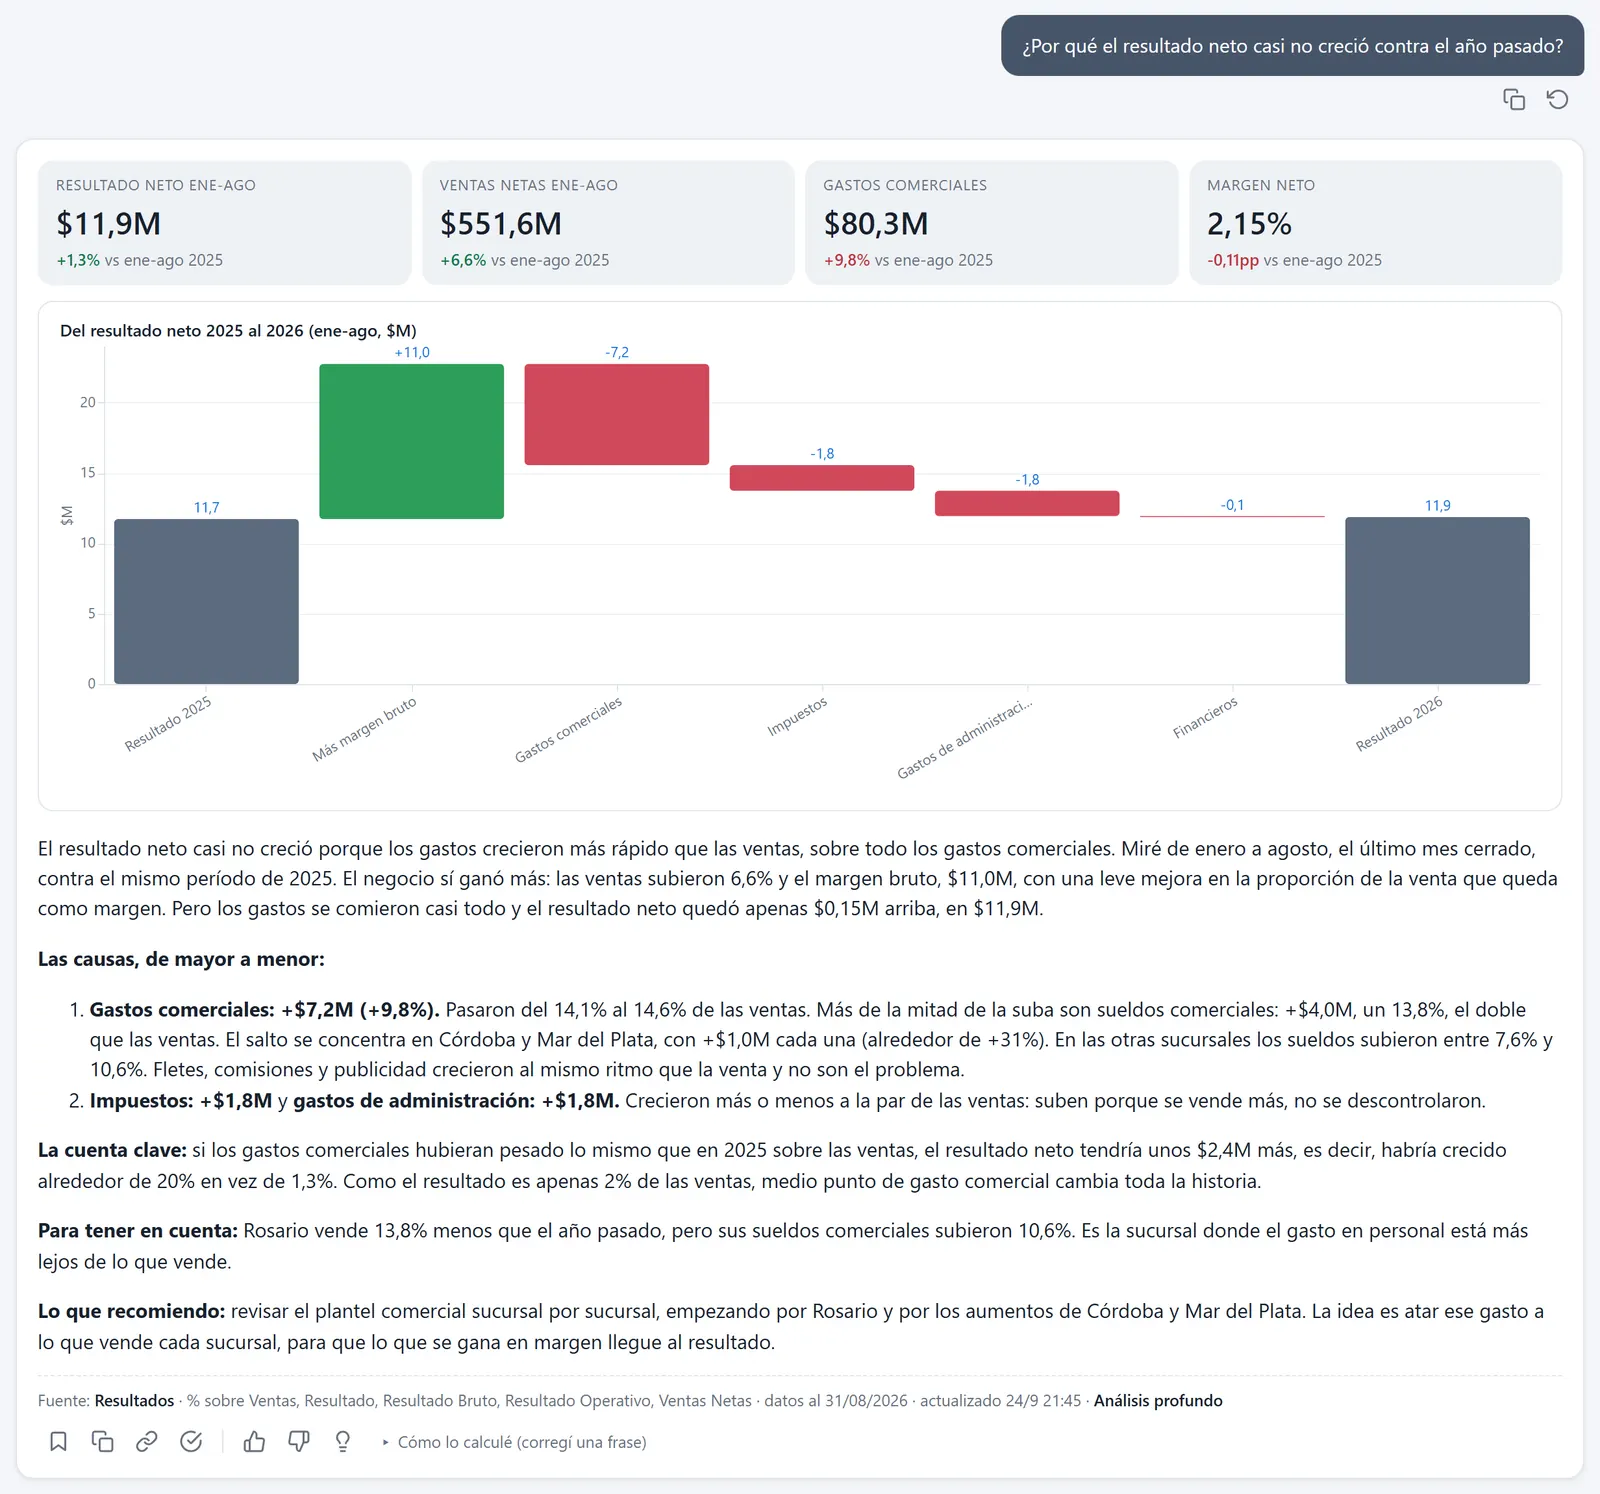
Right: 2.2% January to August, $11.9M on $551.6M.
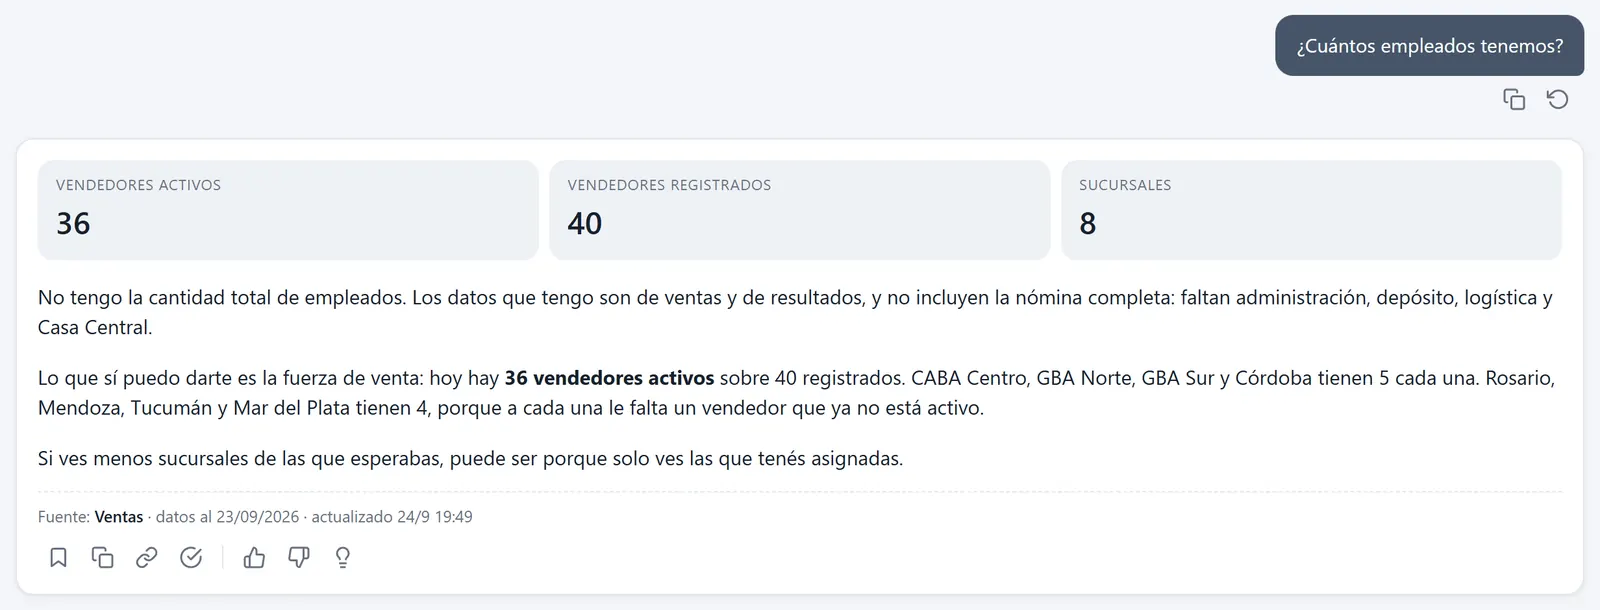
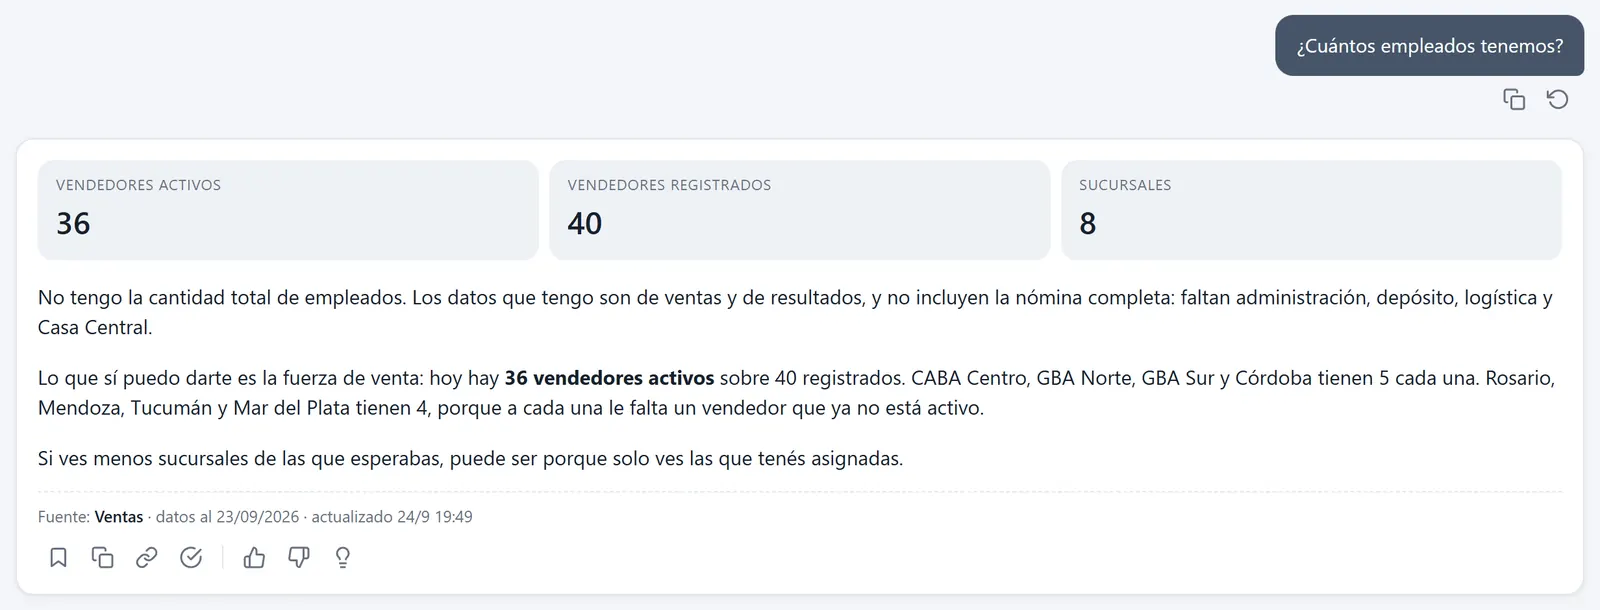
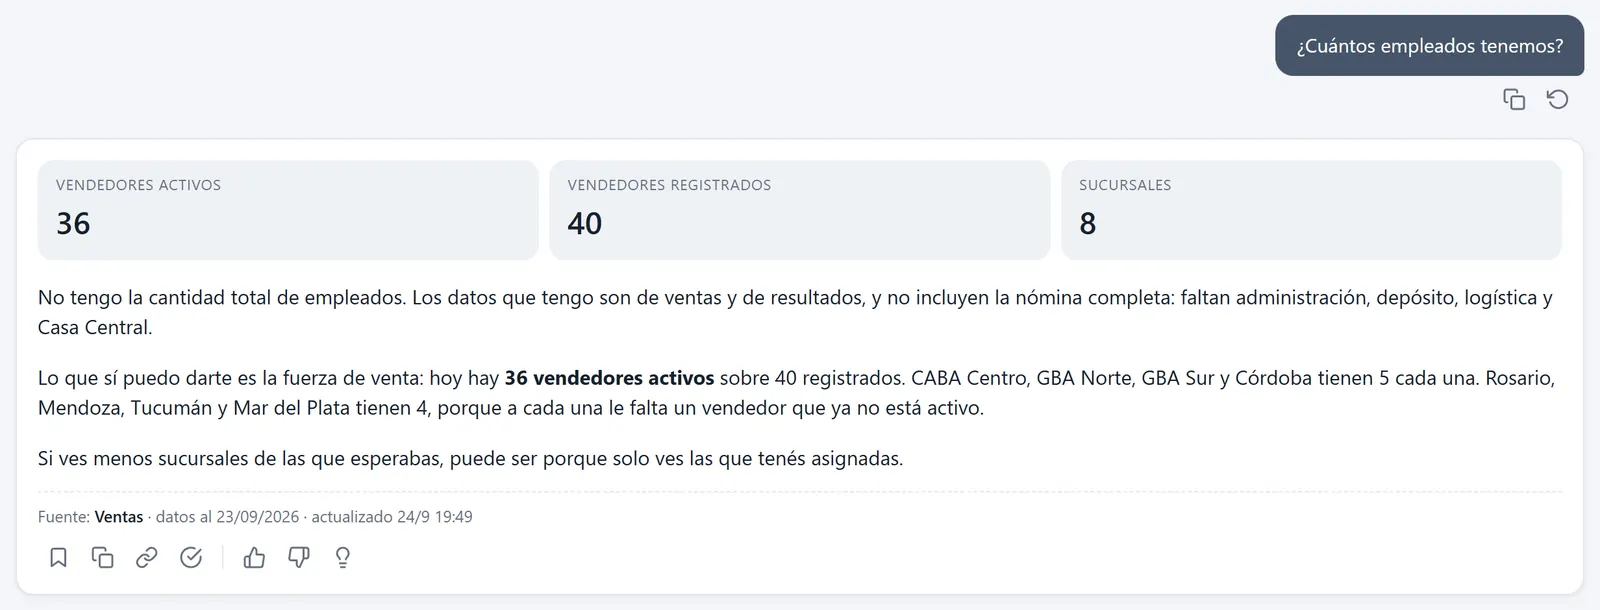
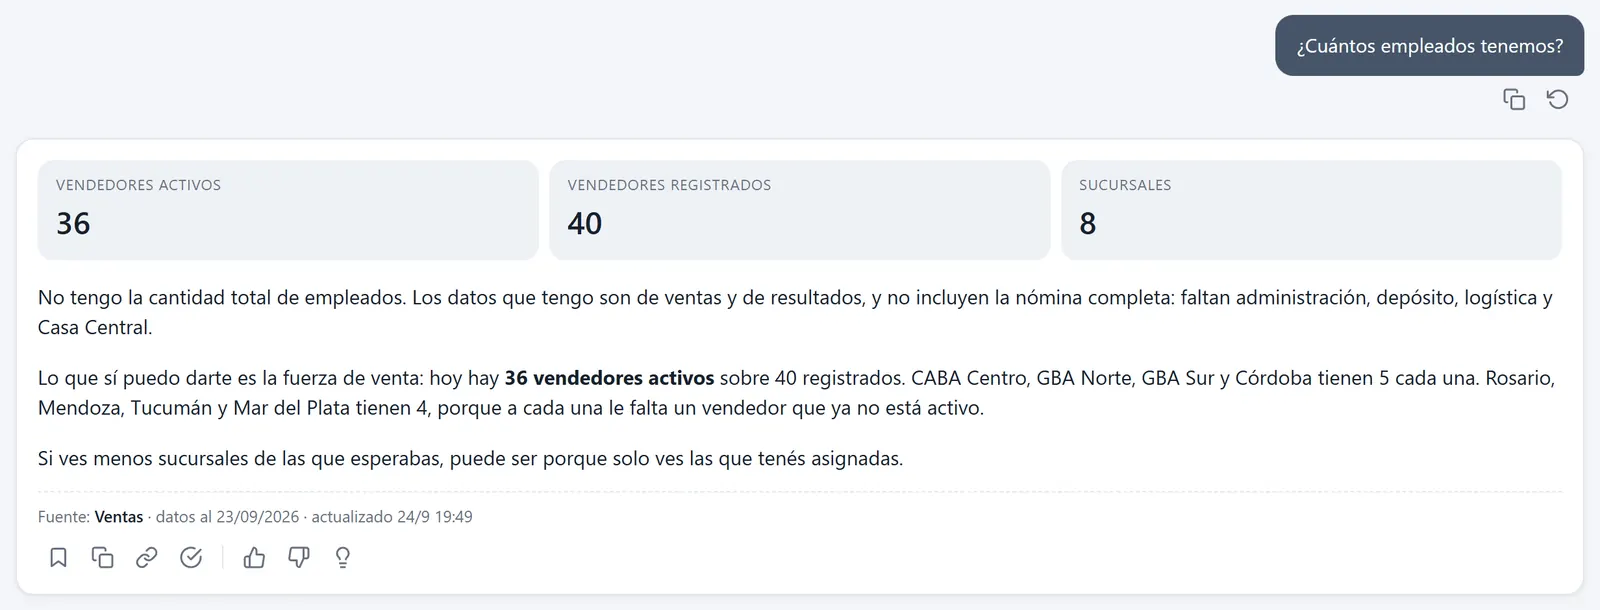
Right: that figure is not in the data. Salespeople are there, and they are a different thing.
"I do not have the total number of employees." It gives the 36 active salespeople, noting that is only the sales force.
There is no employee data. It gives the 36 salespeople, noting they are only the sales force.
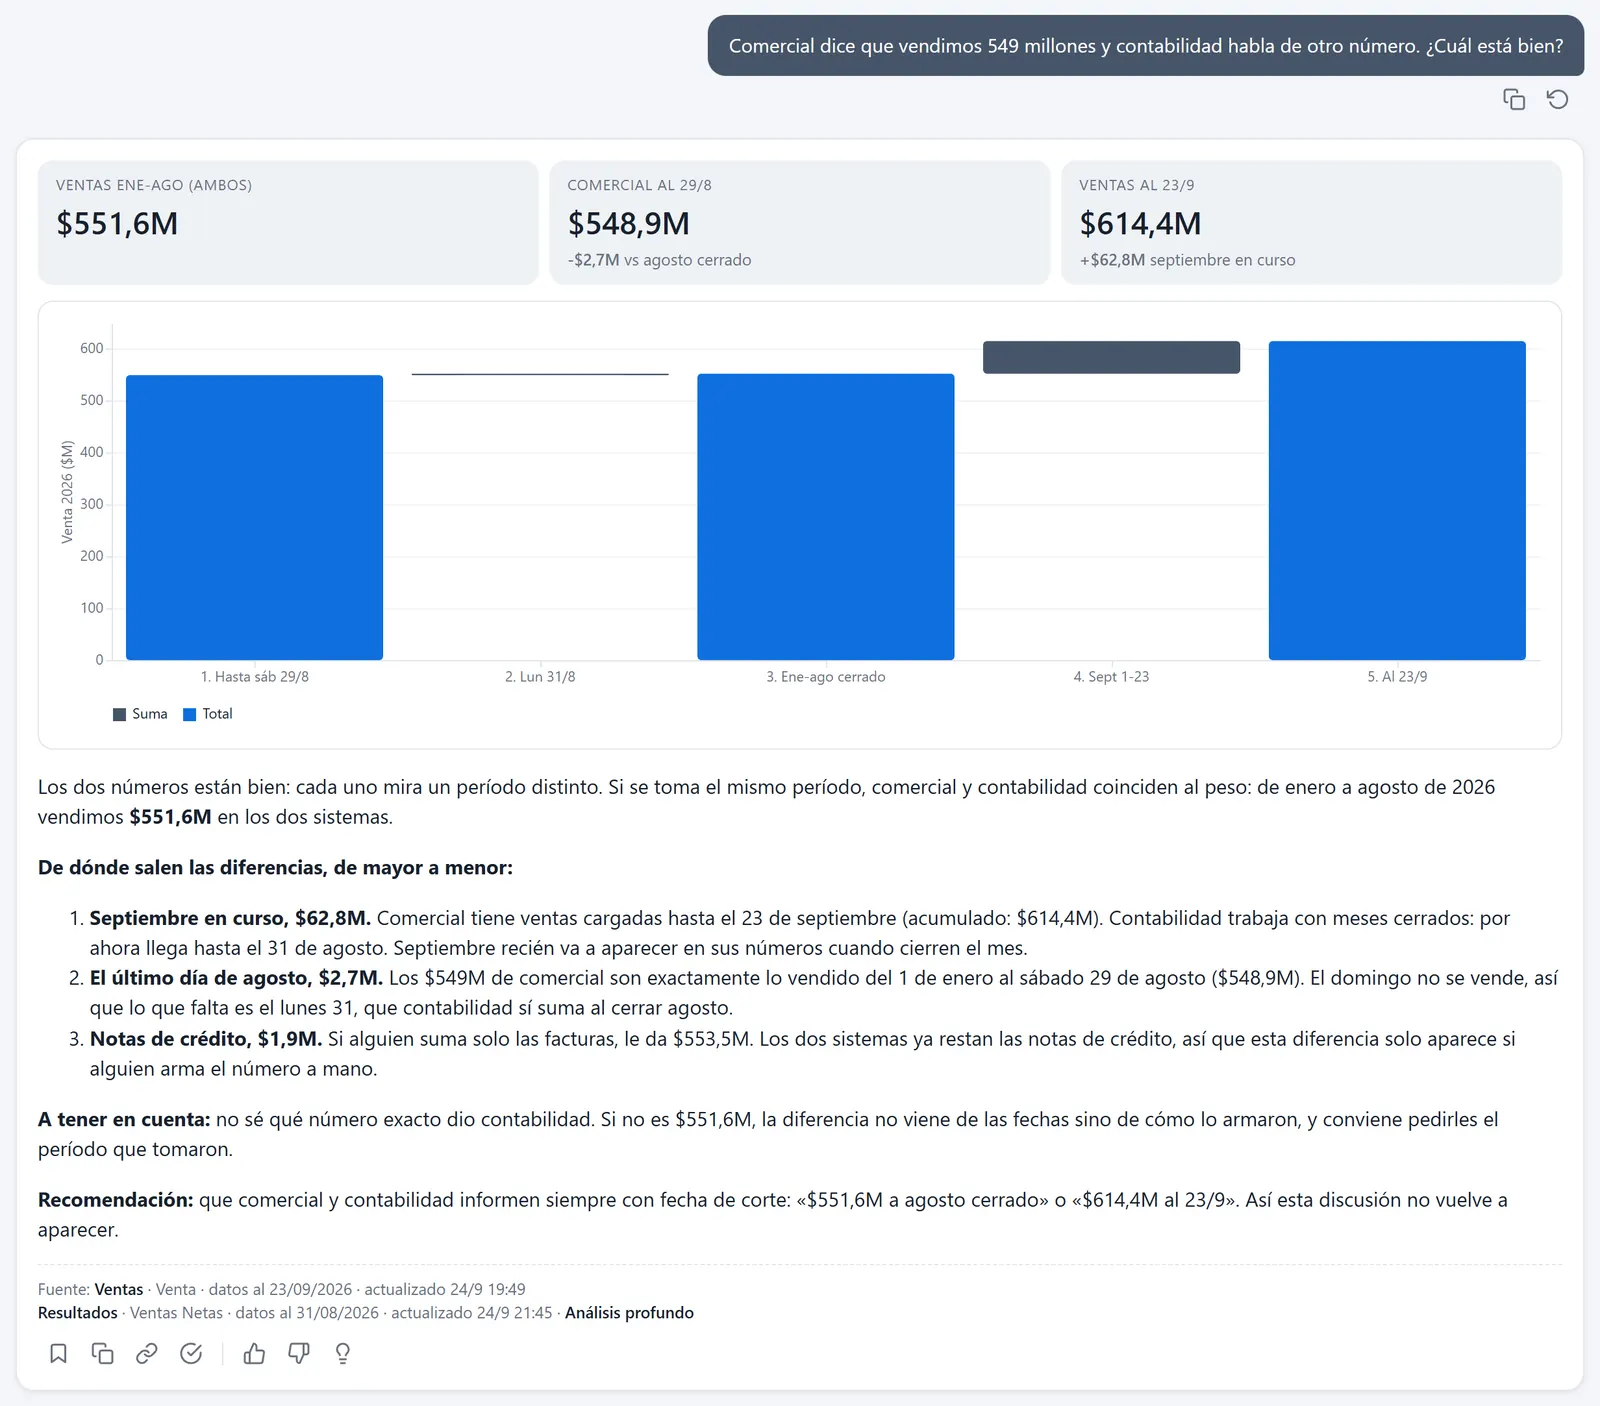
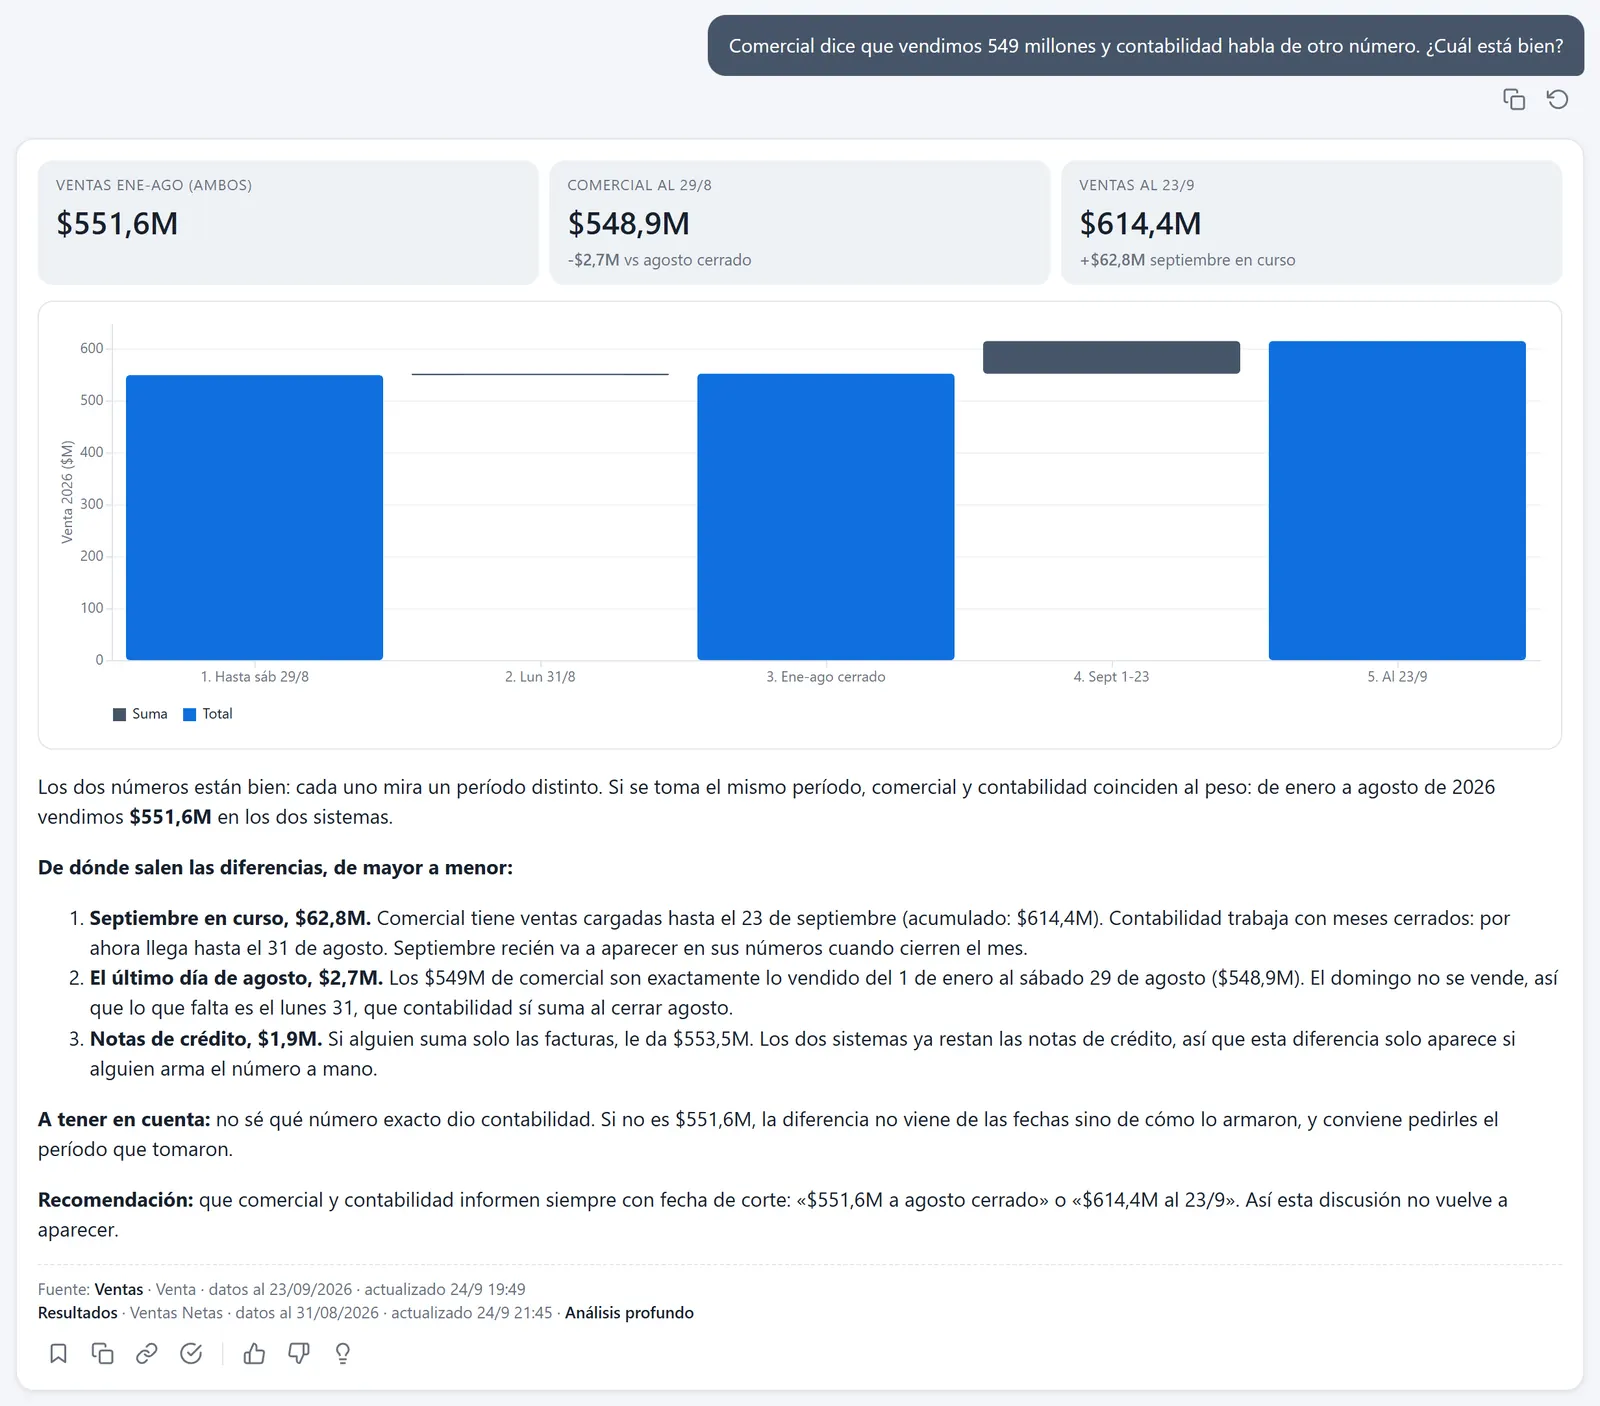
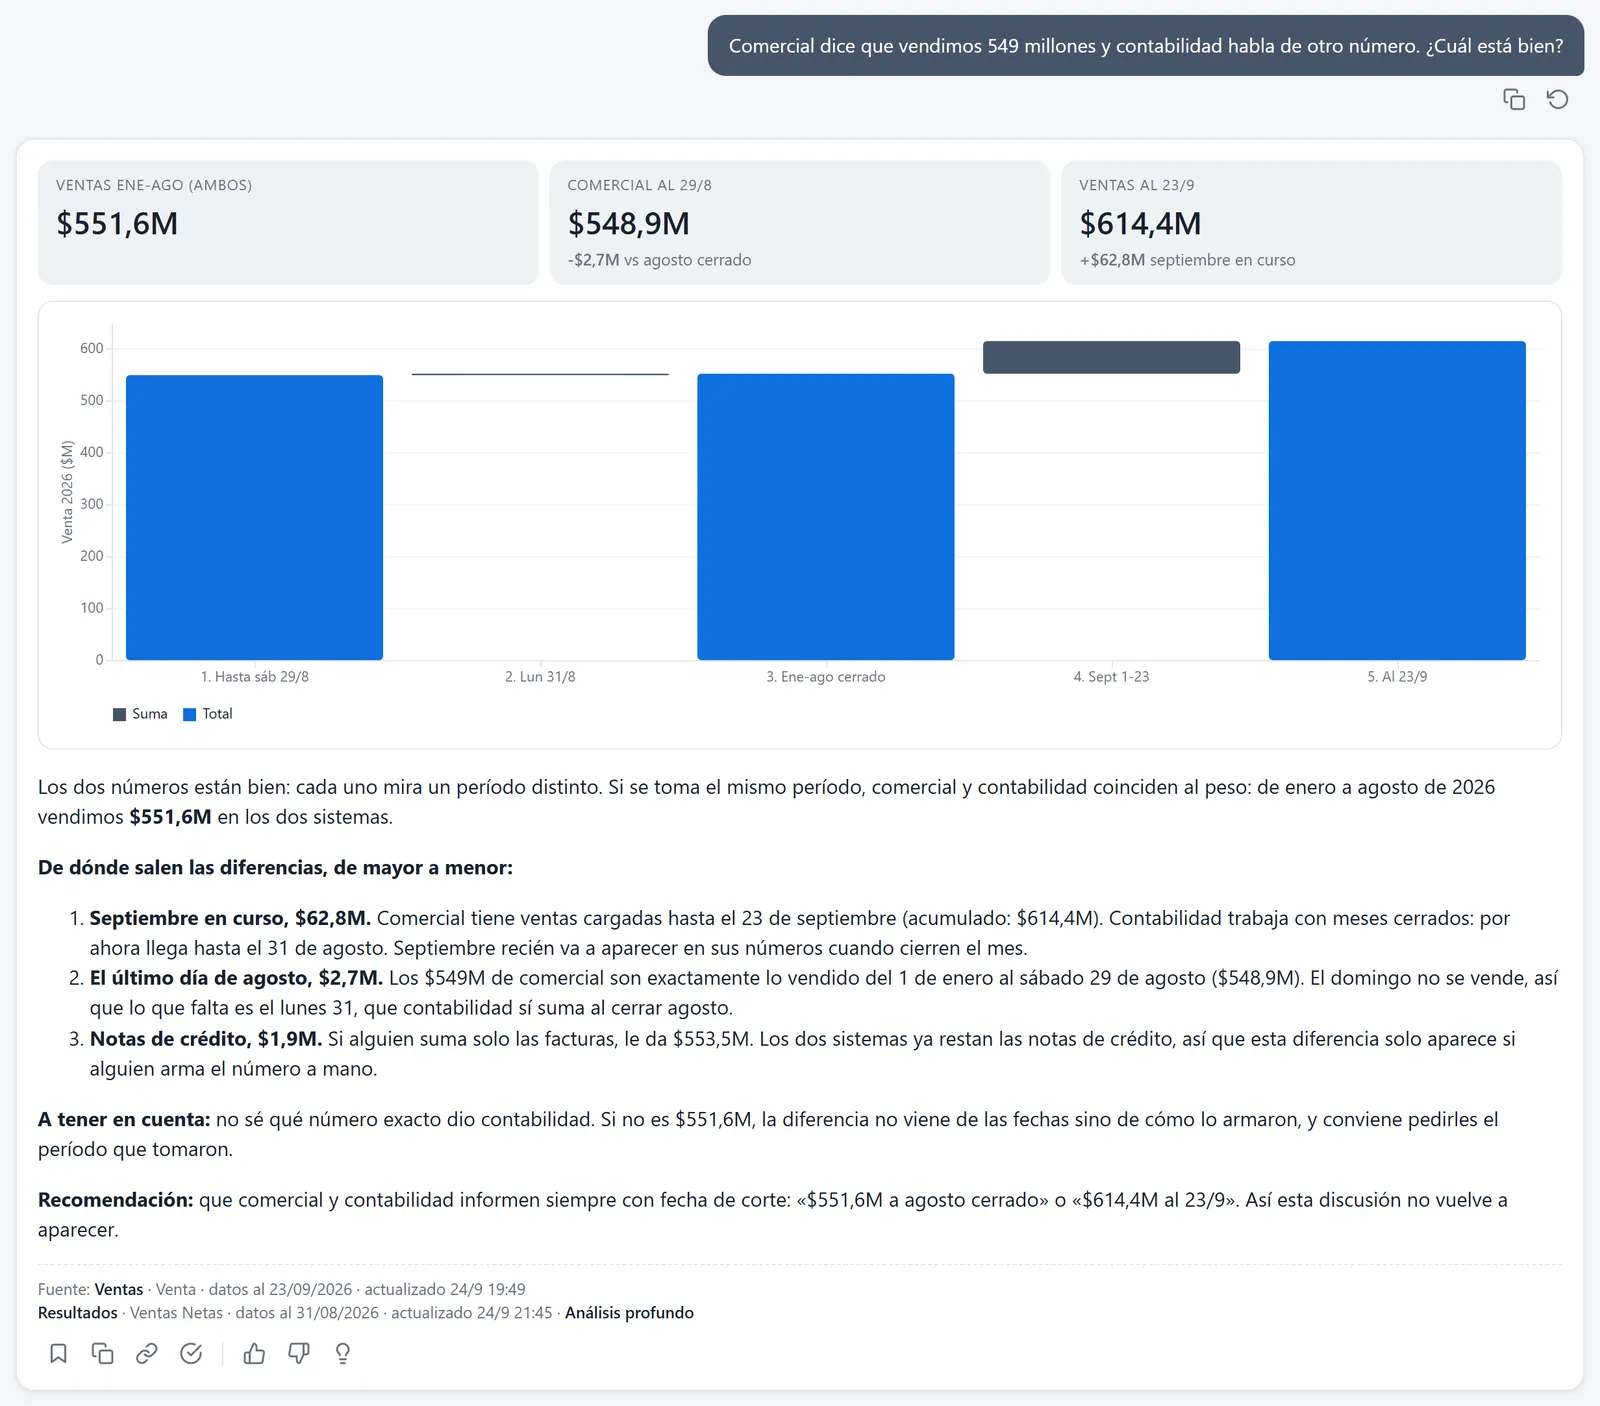
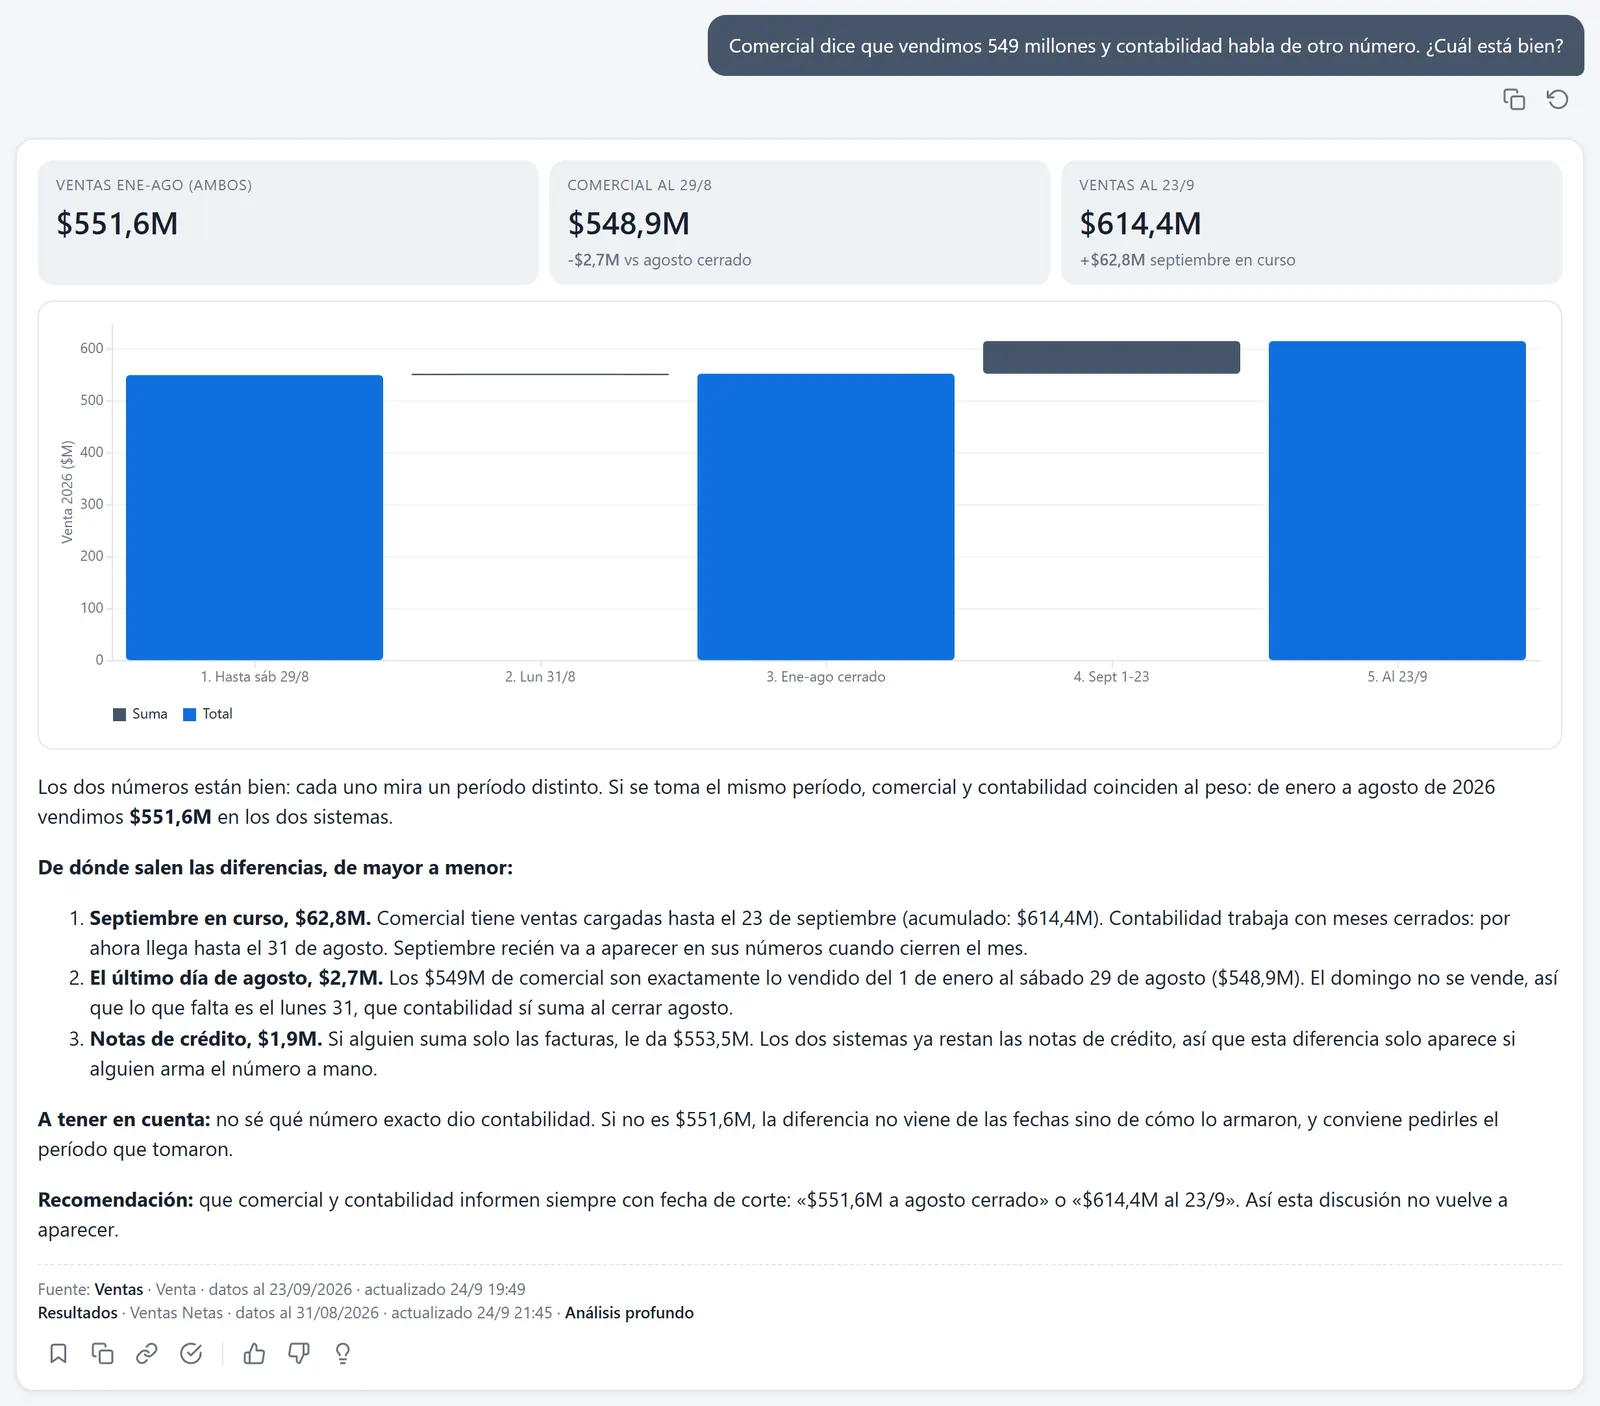
Right: both are right. The 549 is missing August 31; January to August, both come to $551.6M.
The ones that need an analyst
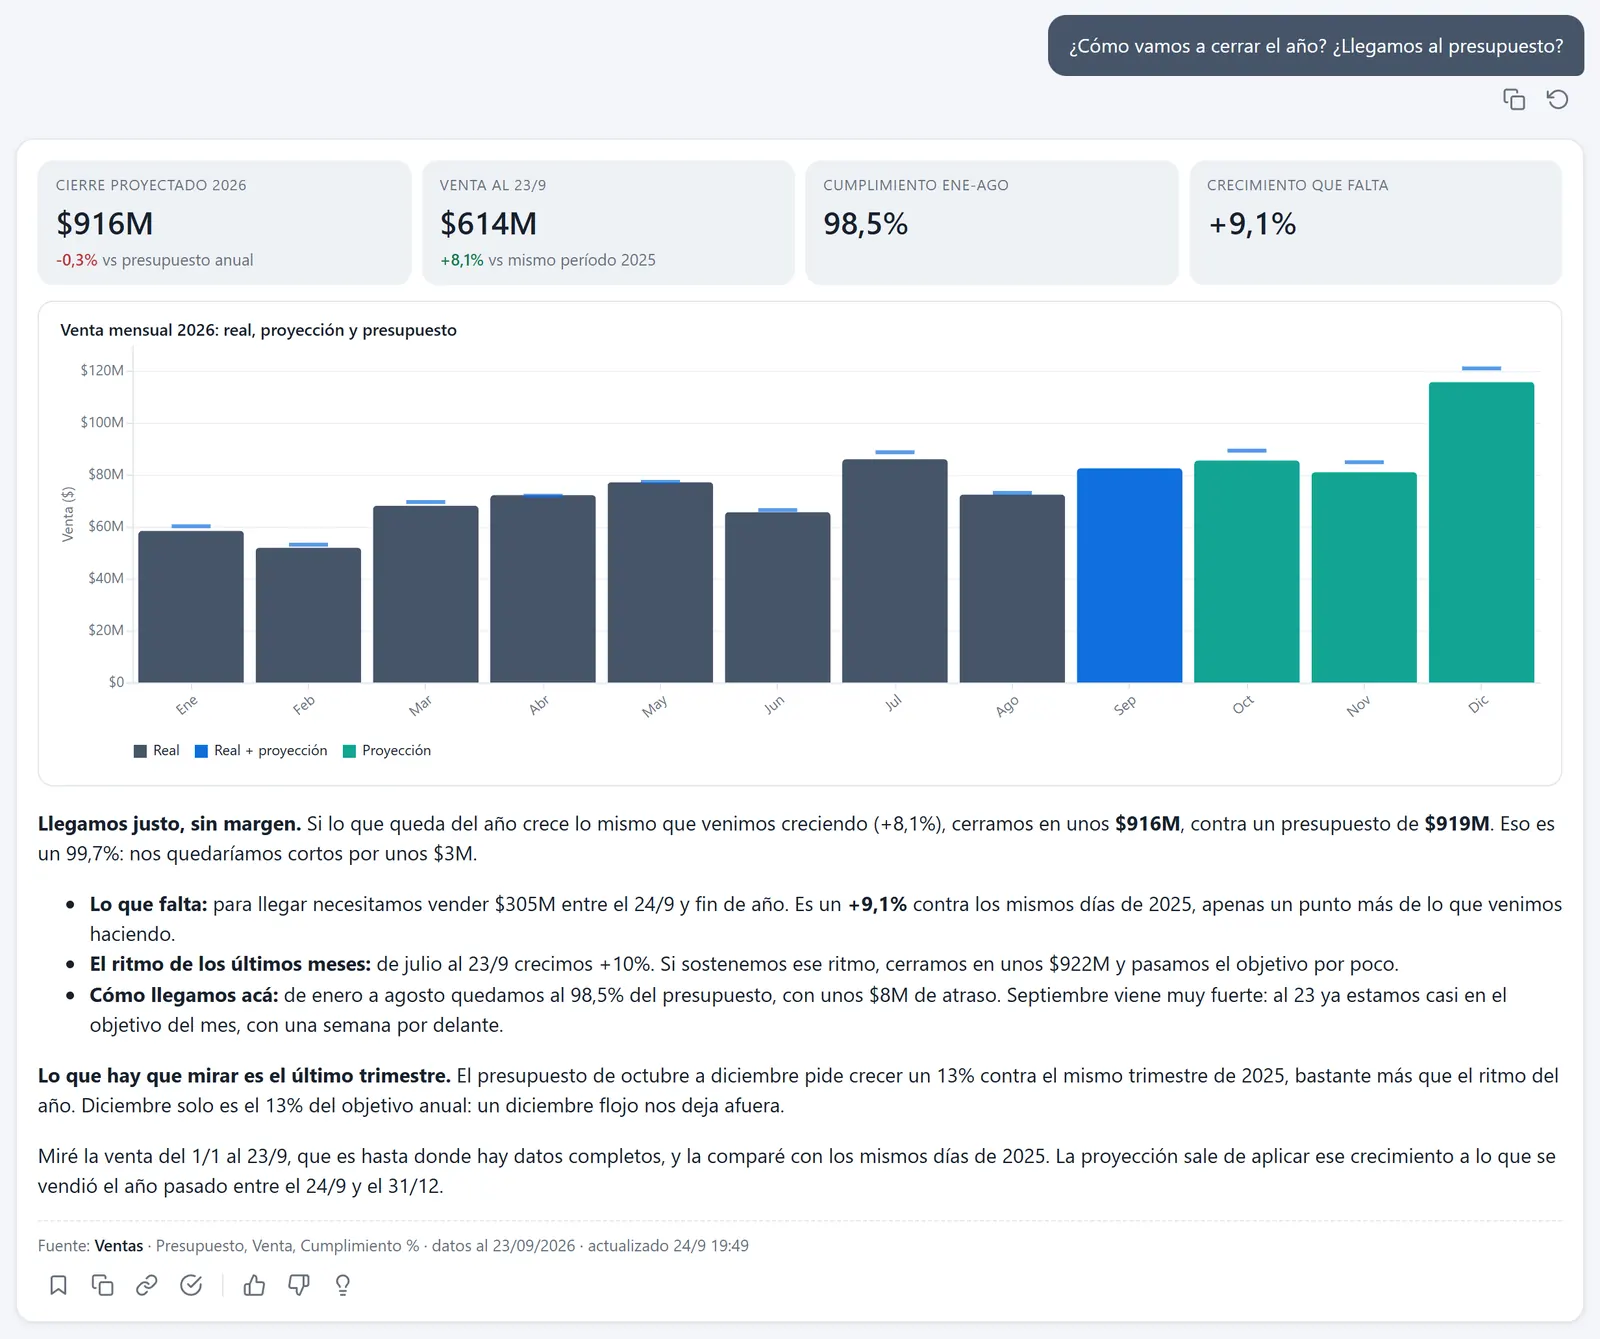
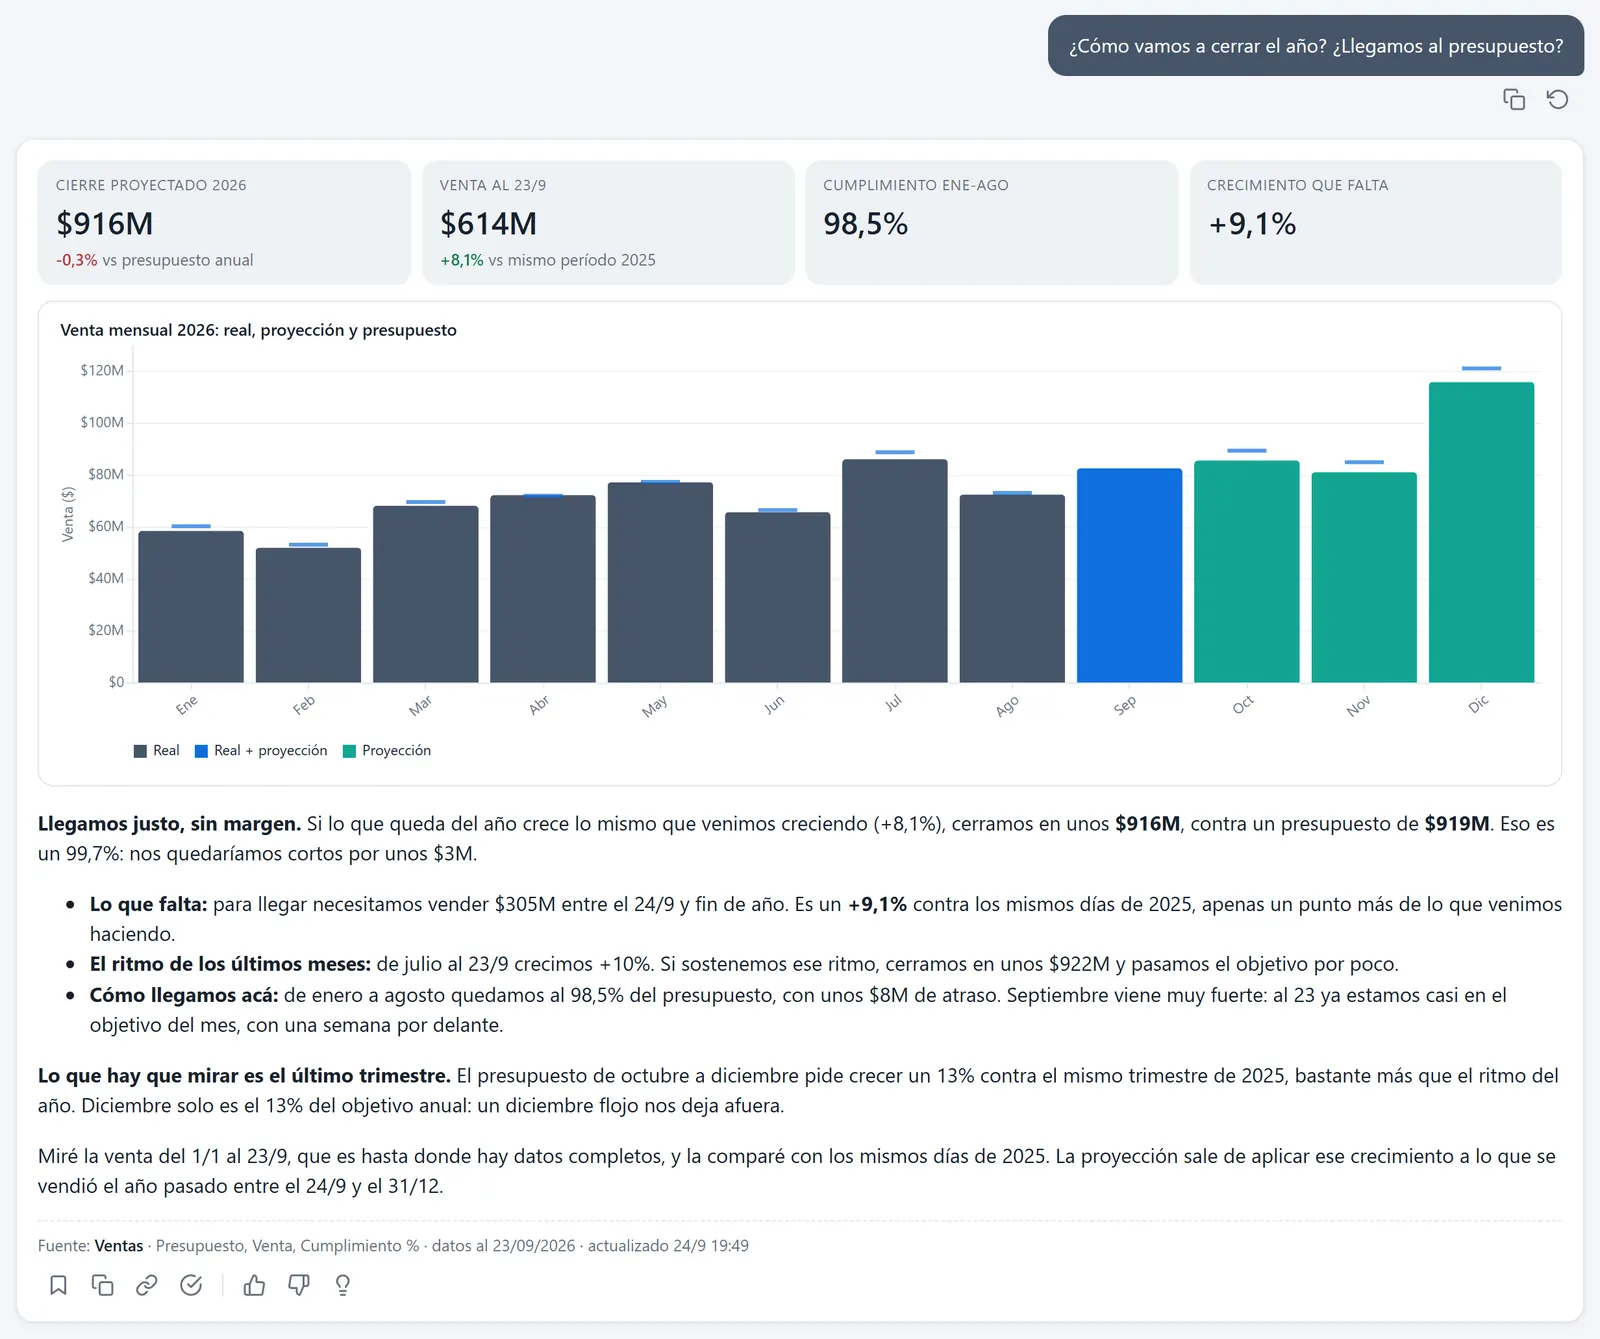
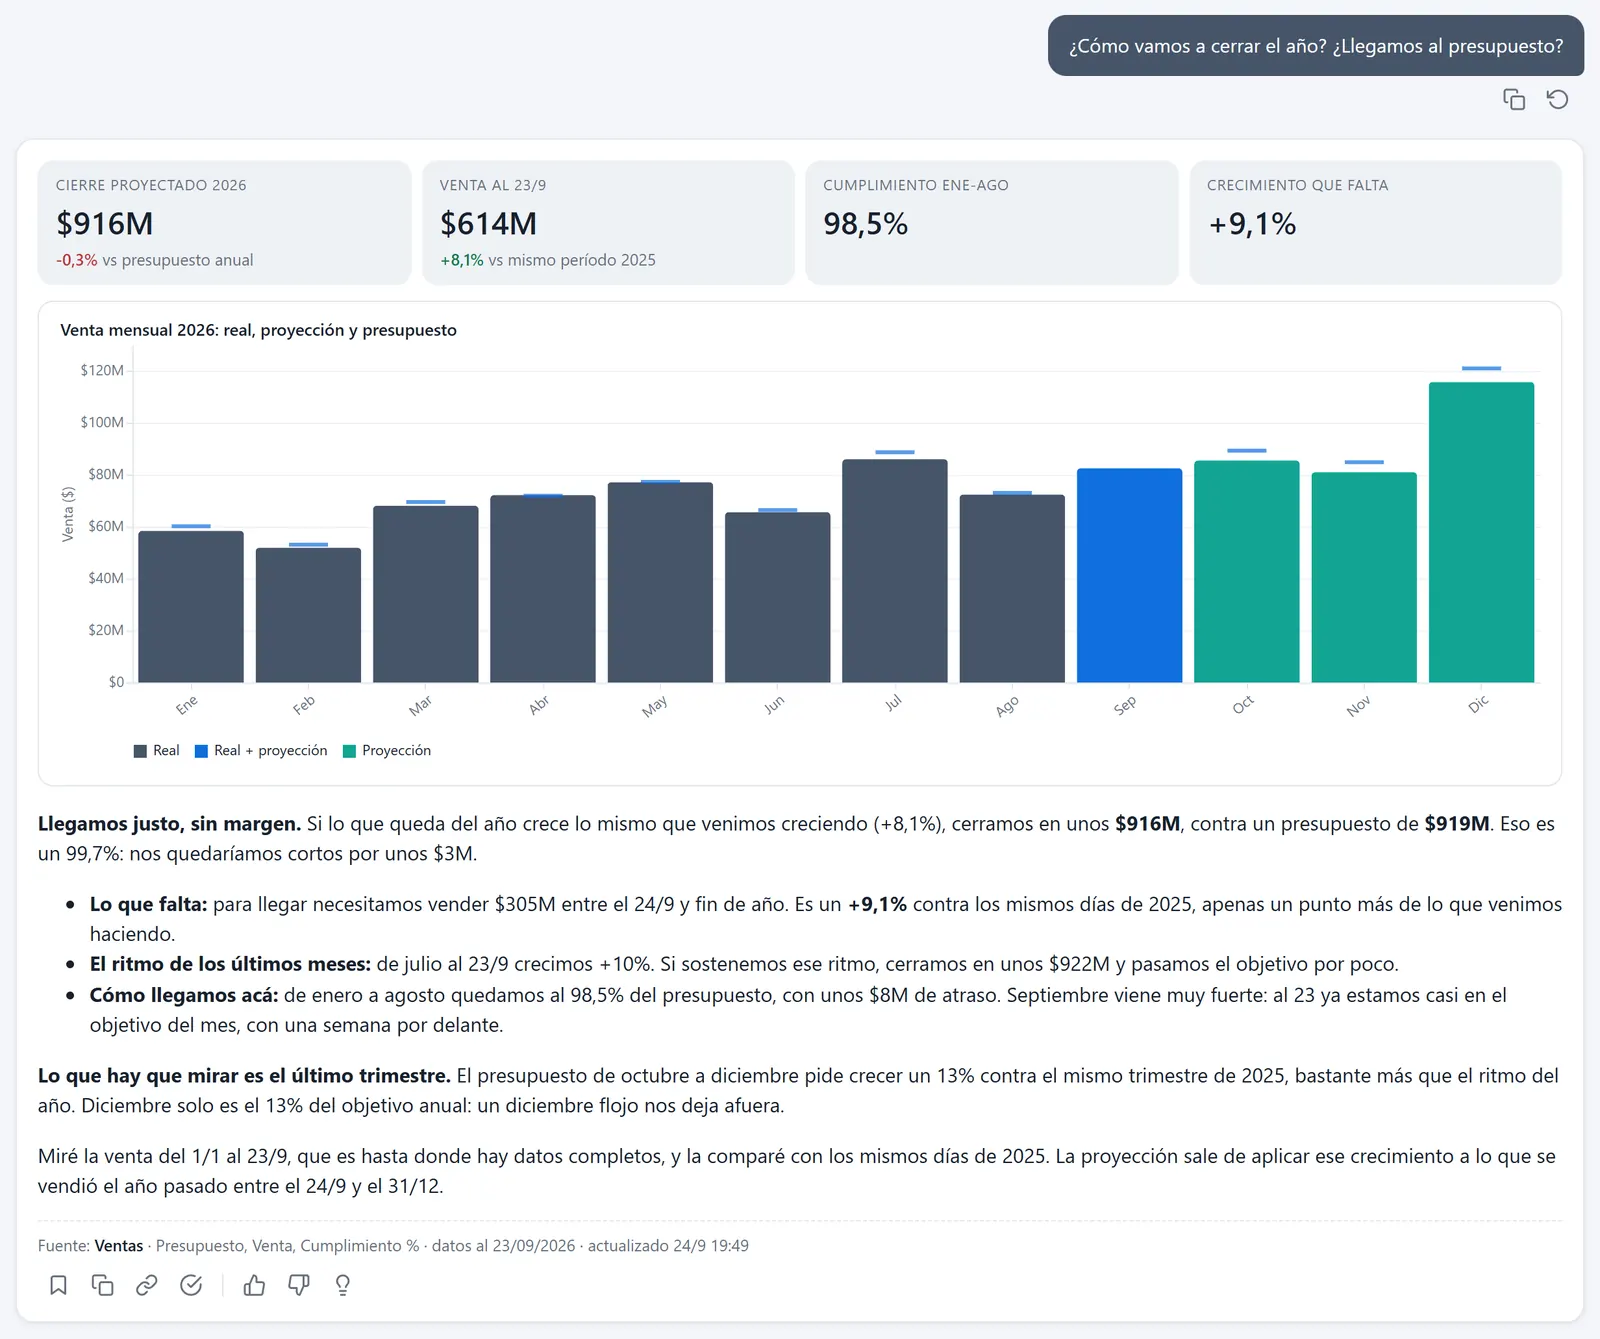
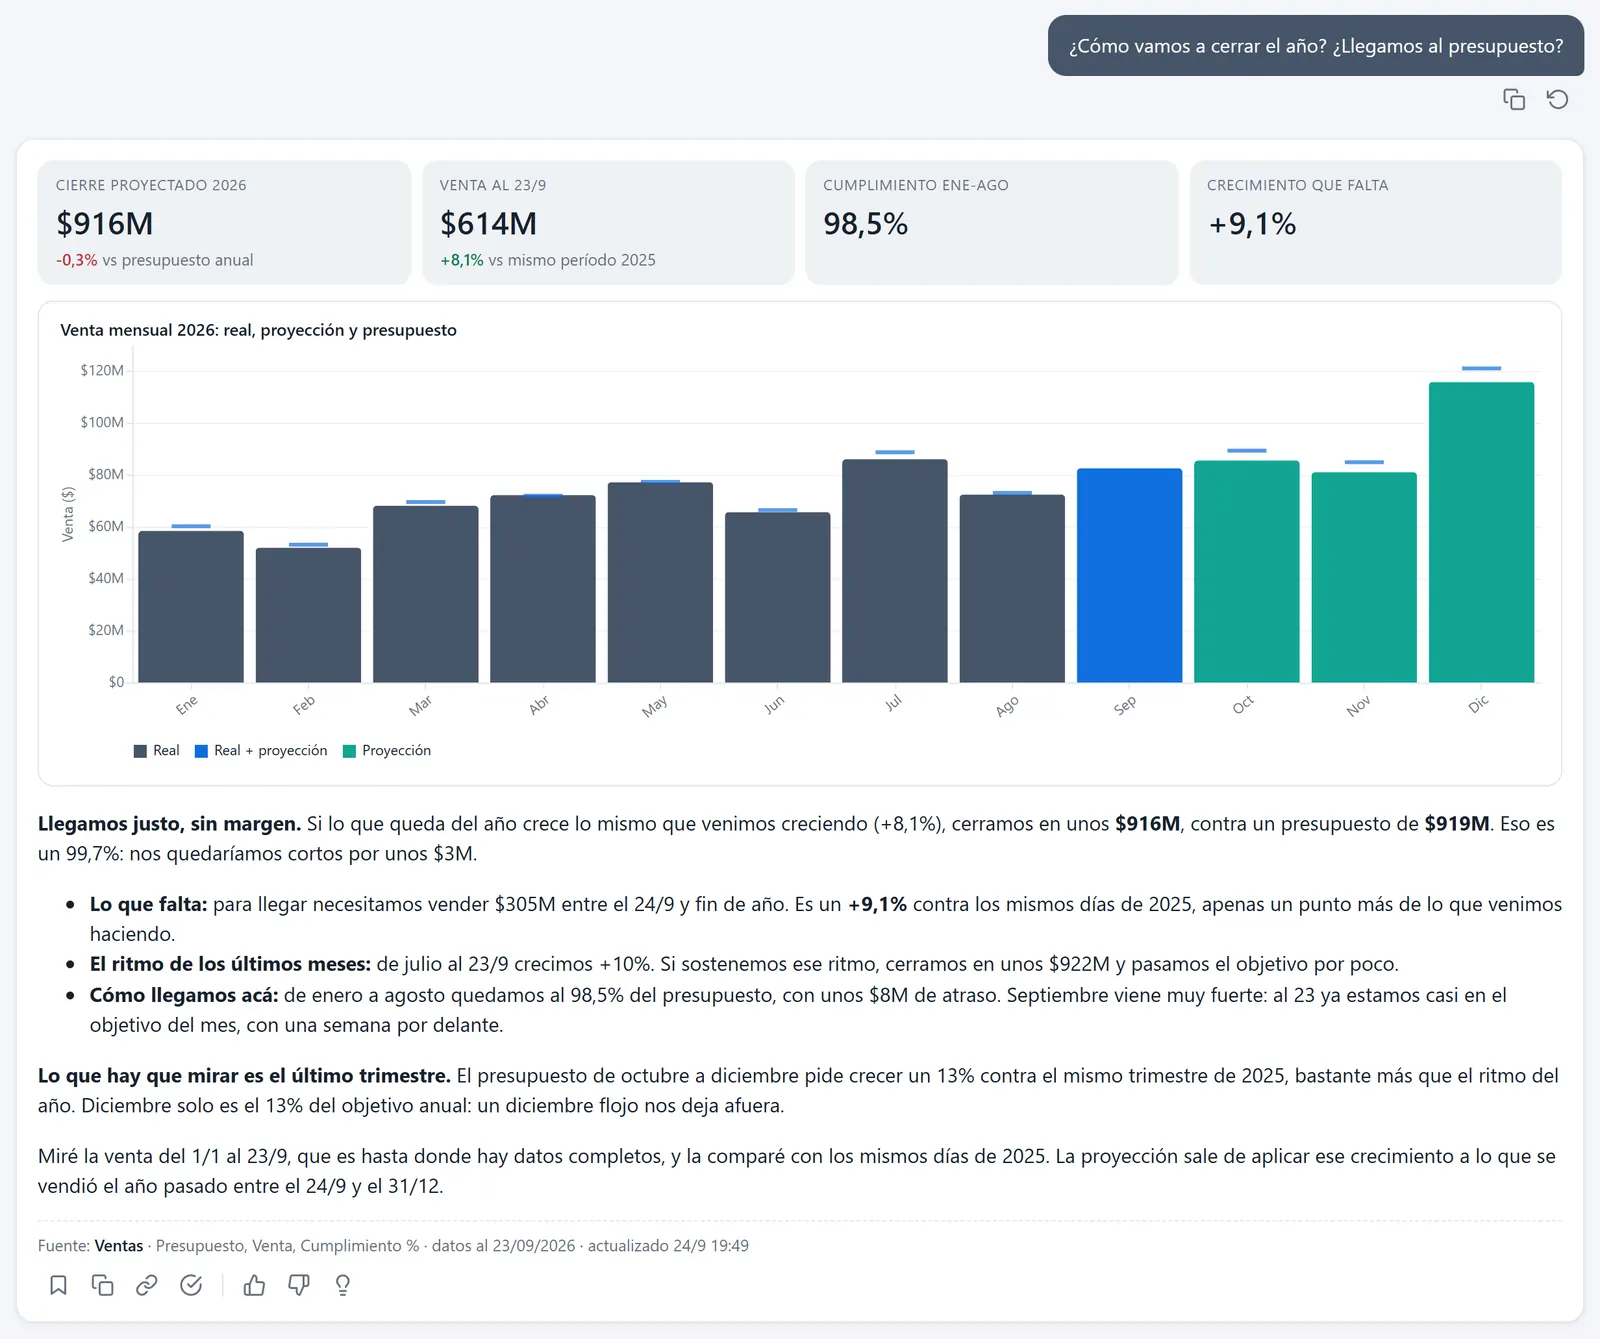
Right: about $916M against $919M. It falls a little short, and the budget is weighted to the last quarter.
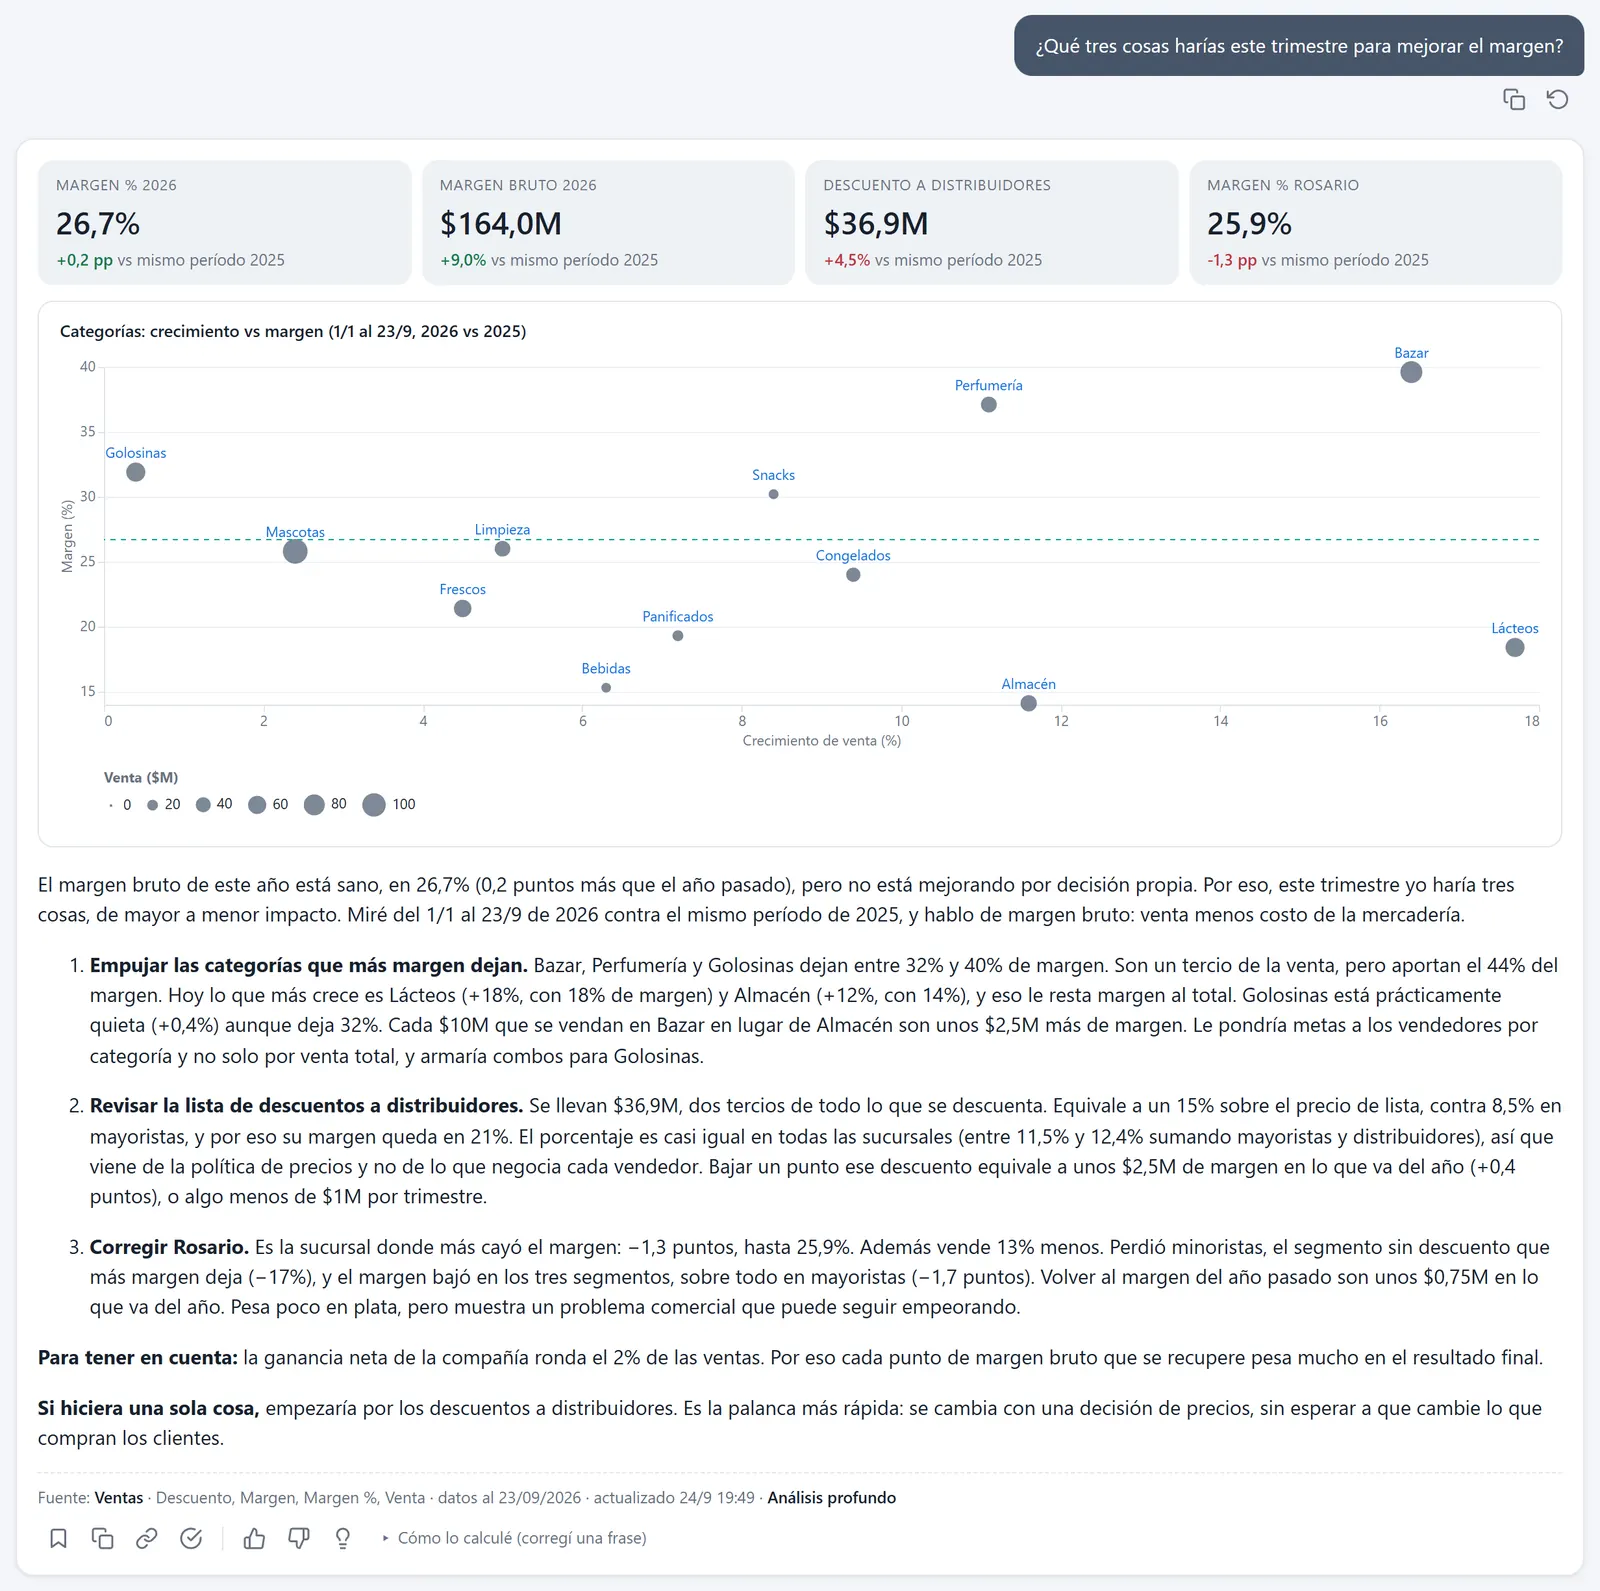
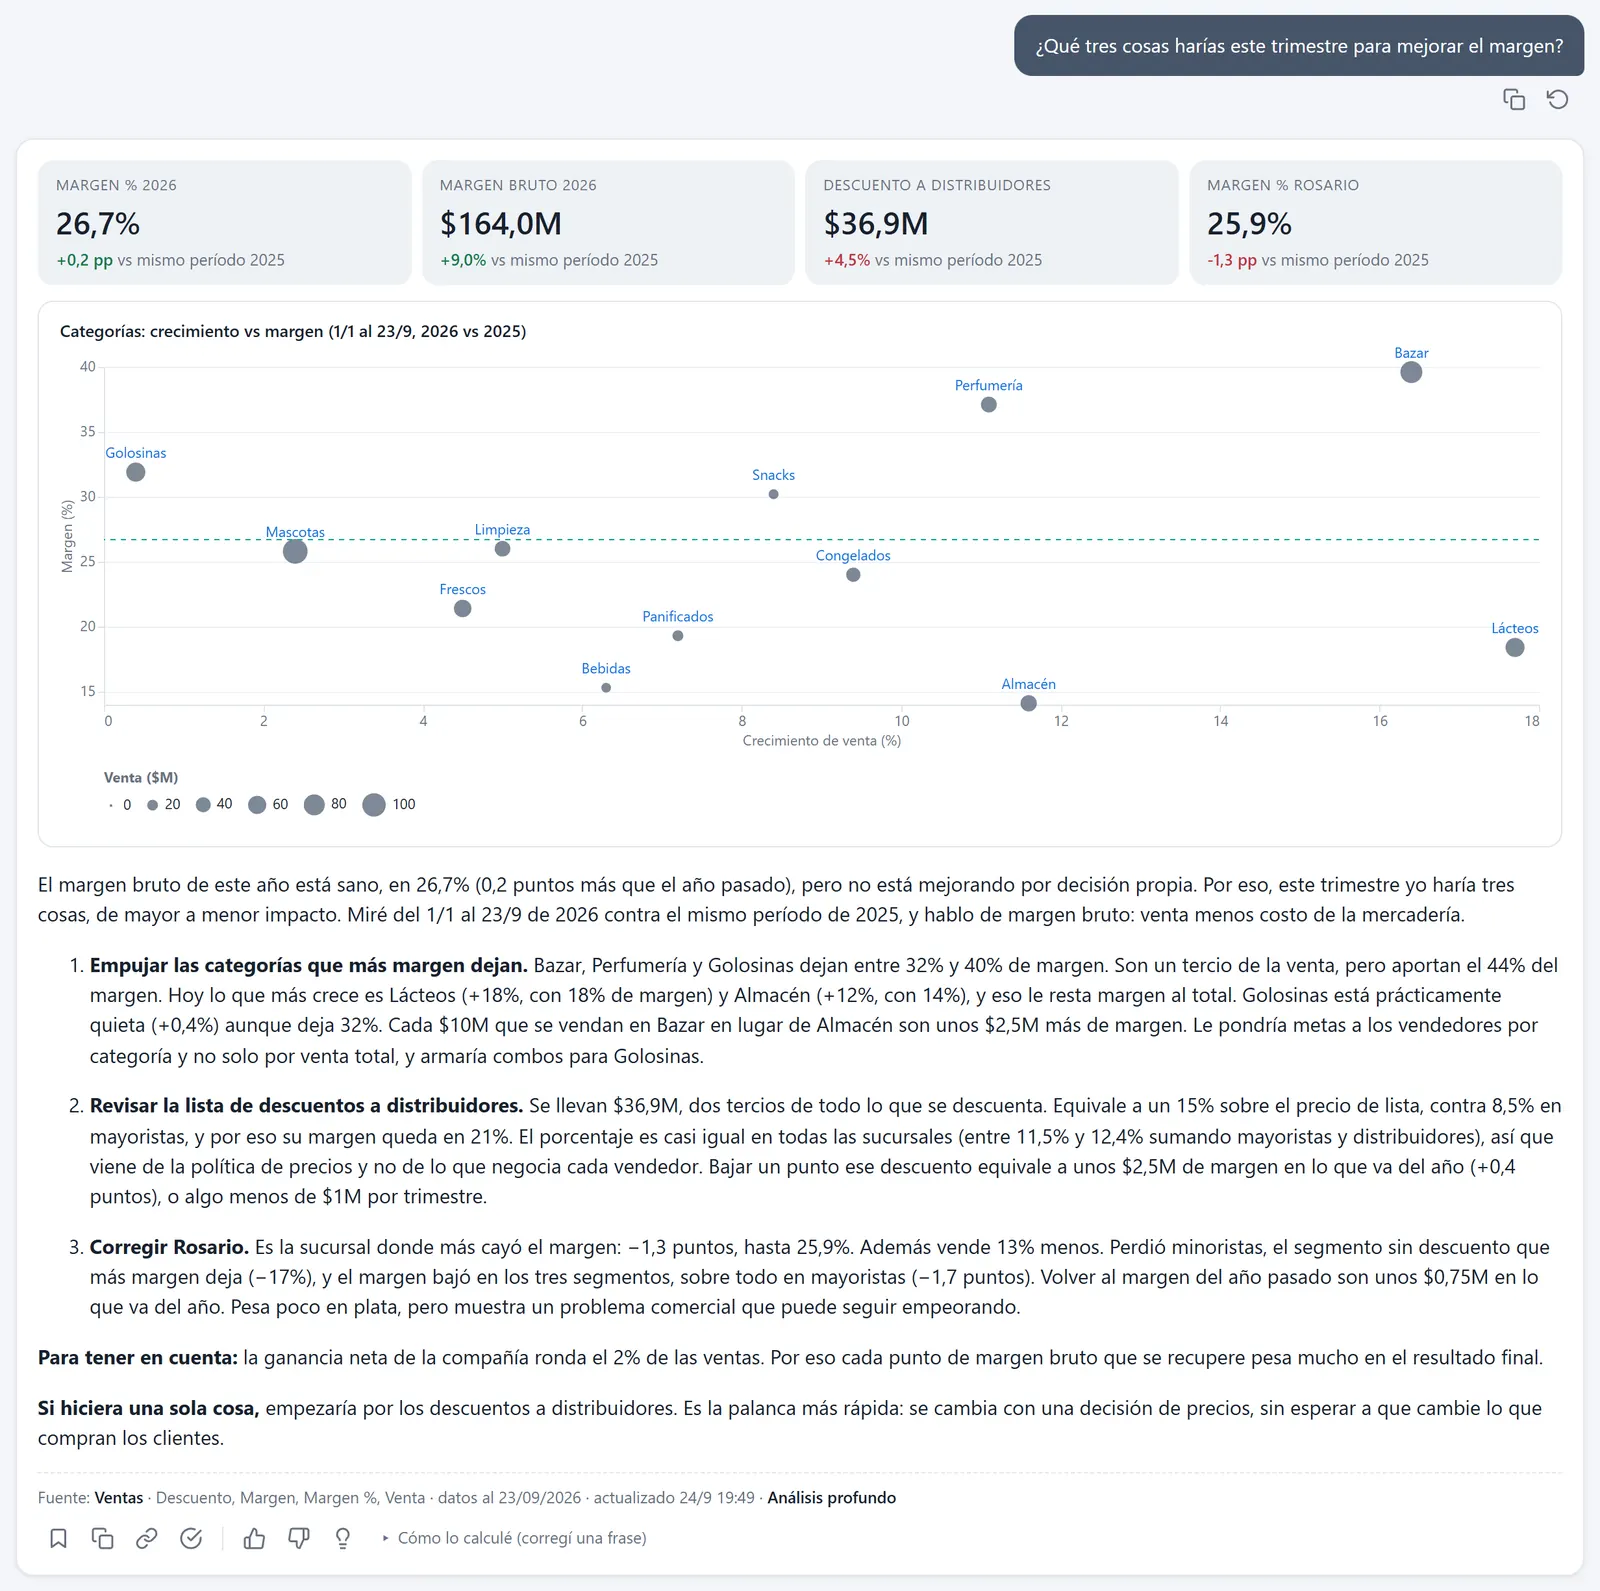
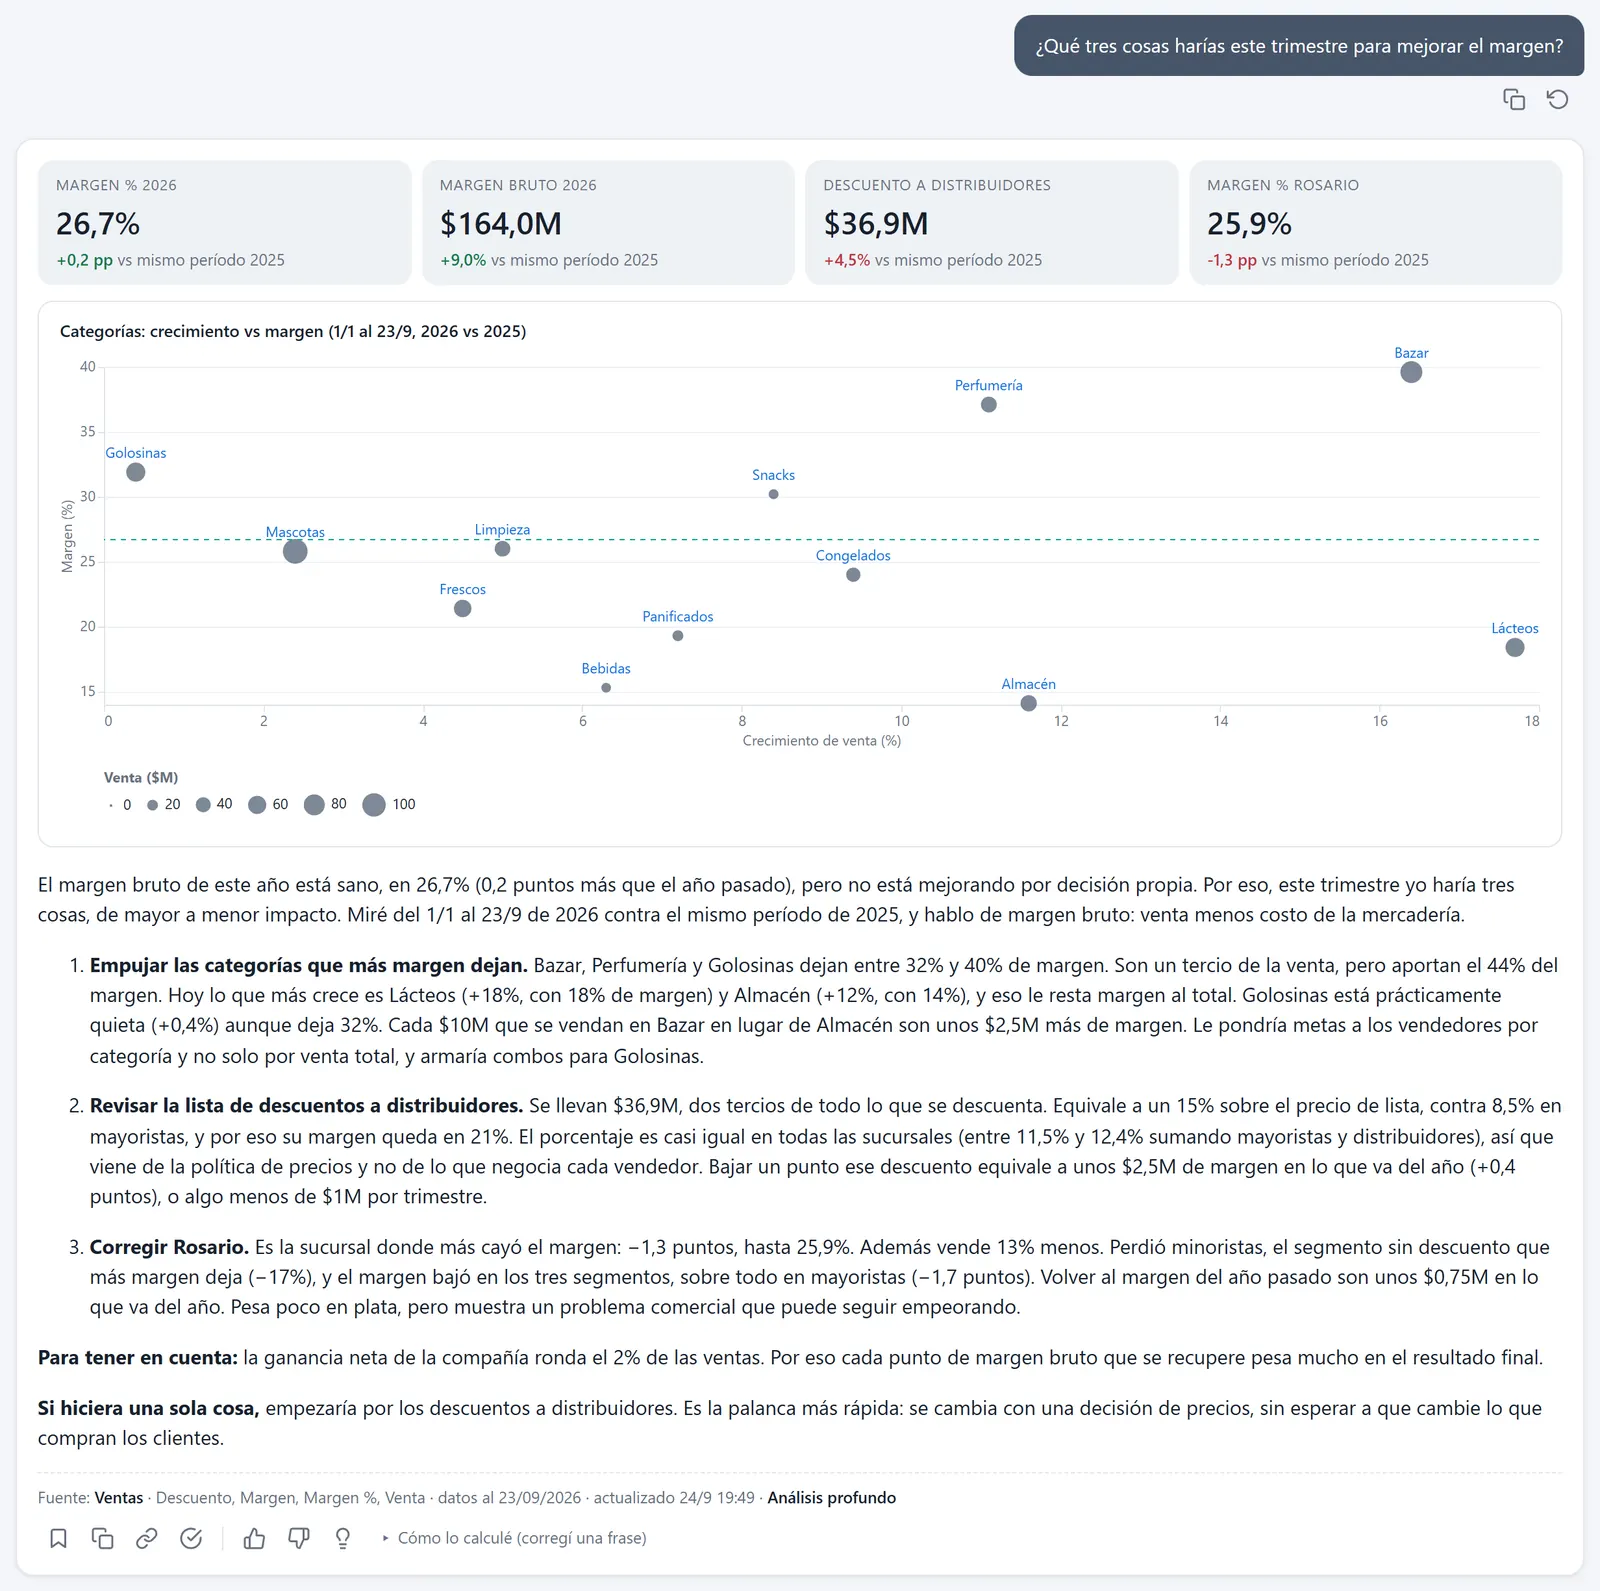
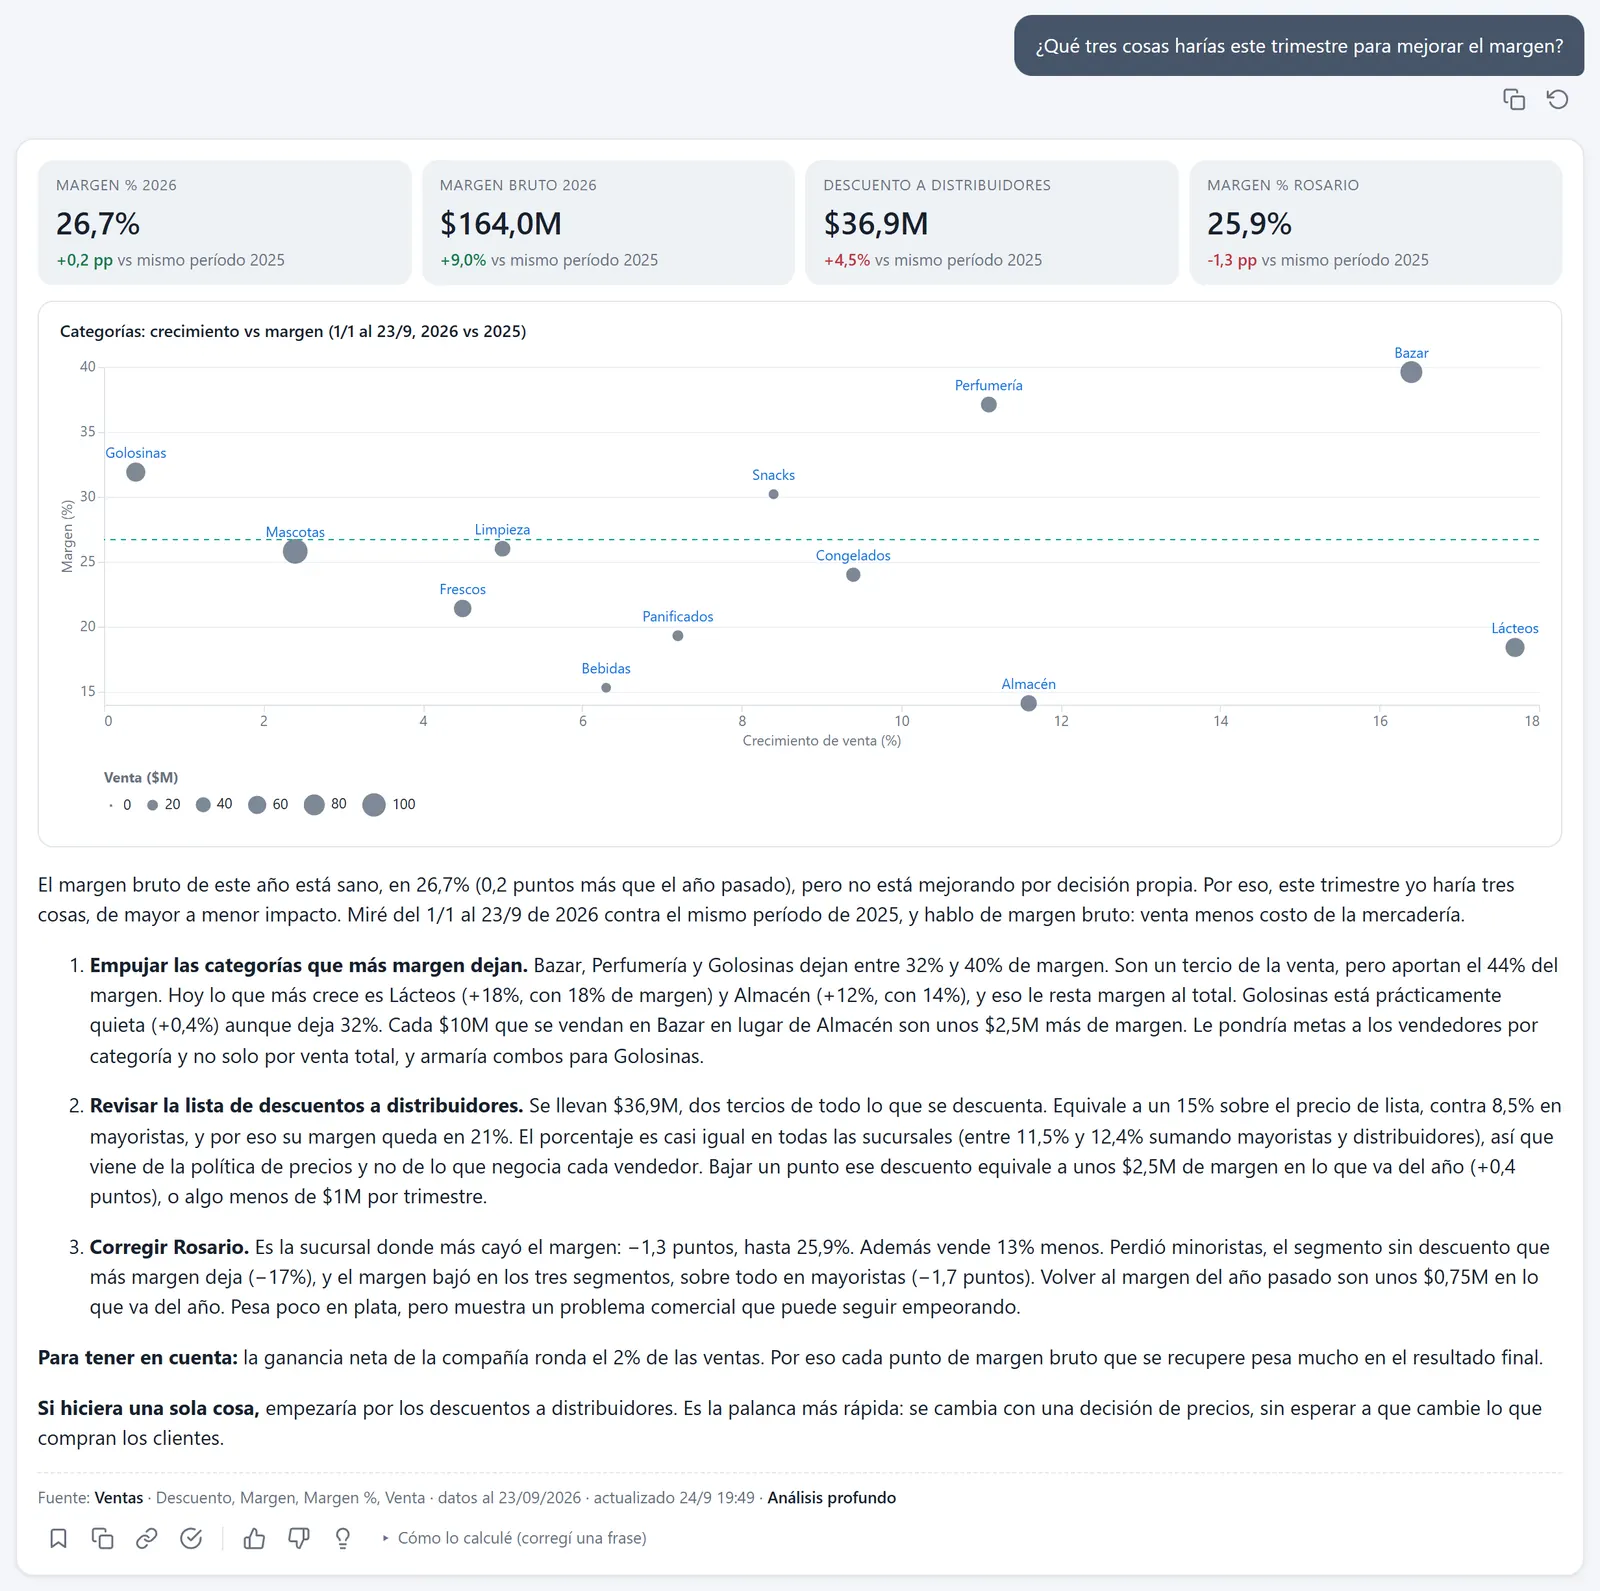
Right: levers with the company's own figures, and how much each one moves.
Three, with numbers: "every $10M in Housewares instead of Groceries is ~$2.5M more margin"; and the distributor discount, where one point is ~$2.5M.
Two queries hung in the MCP. It gets to one measured lever — each point of discount, ~$2.4M a quarter — and the rest stays a hypothesis.
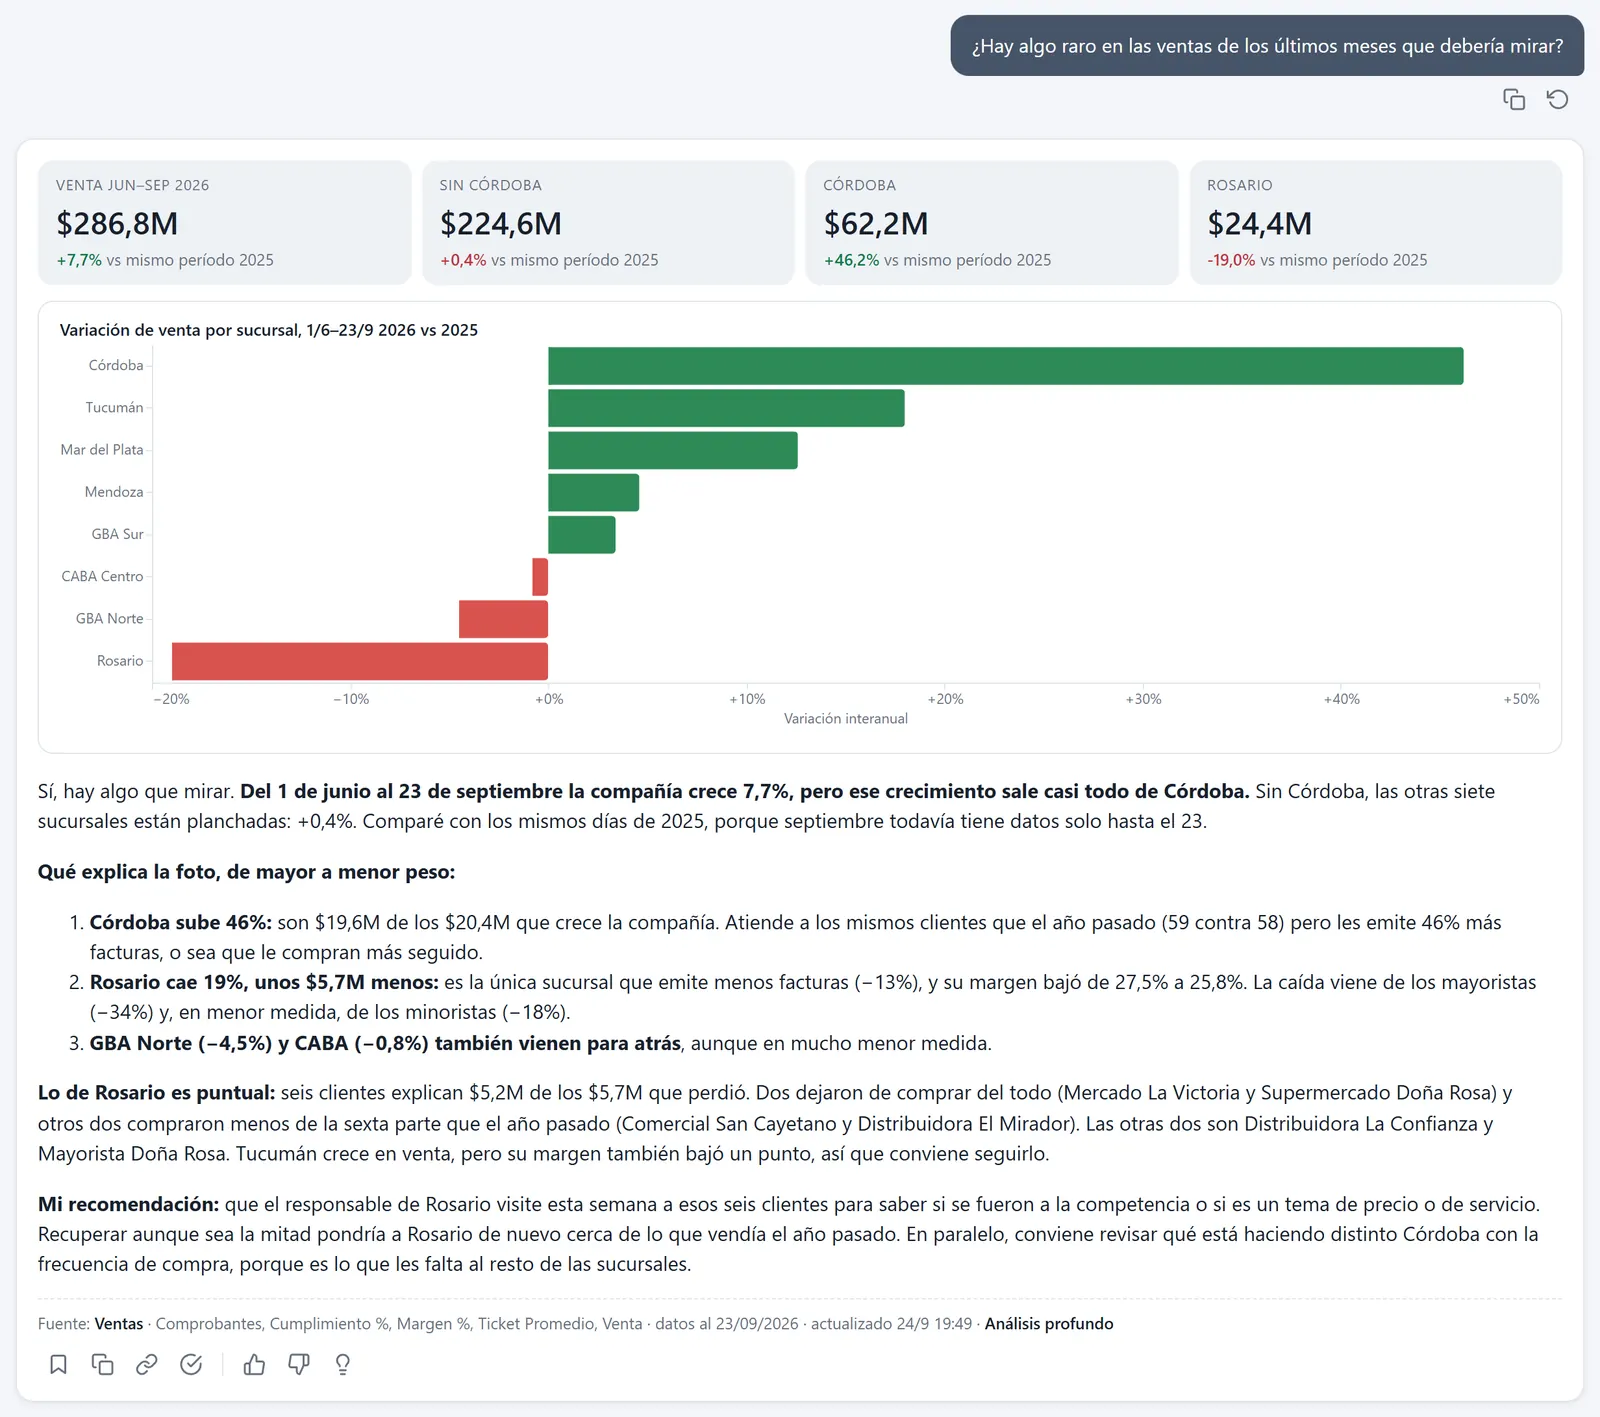
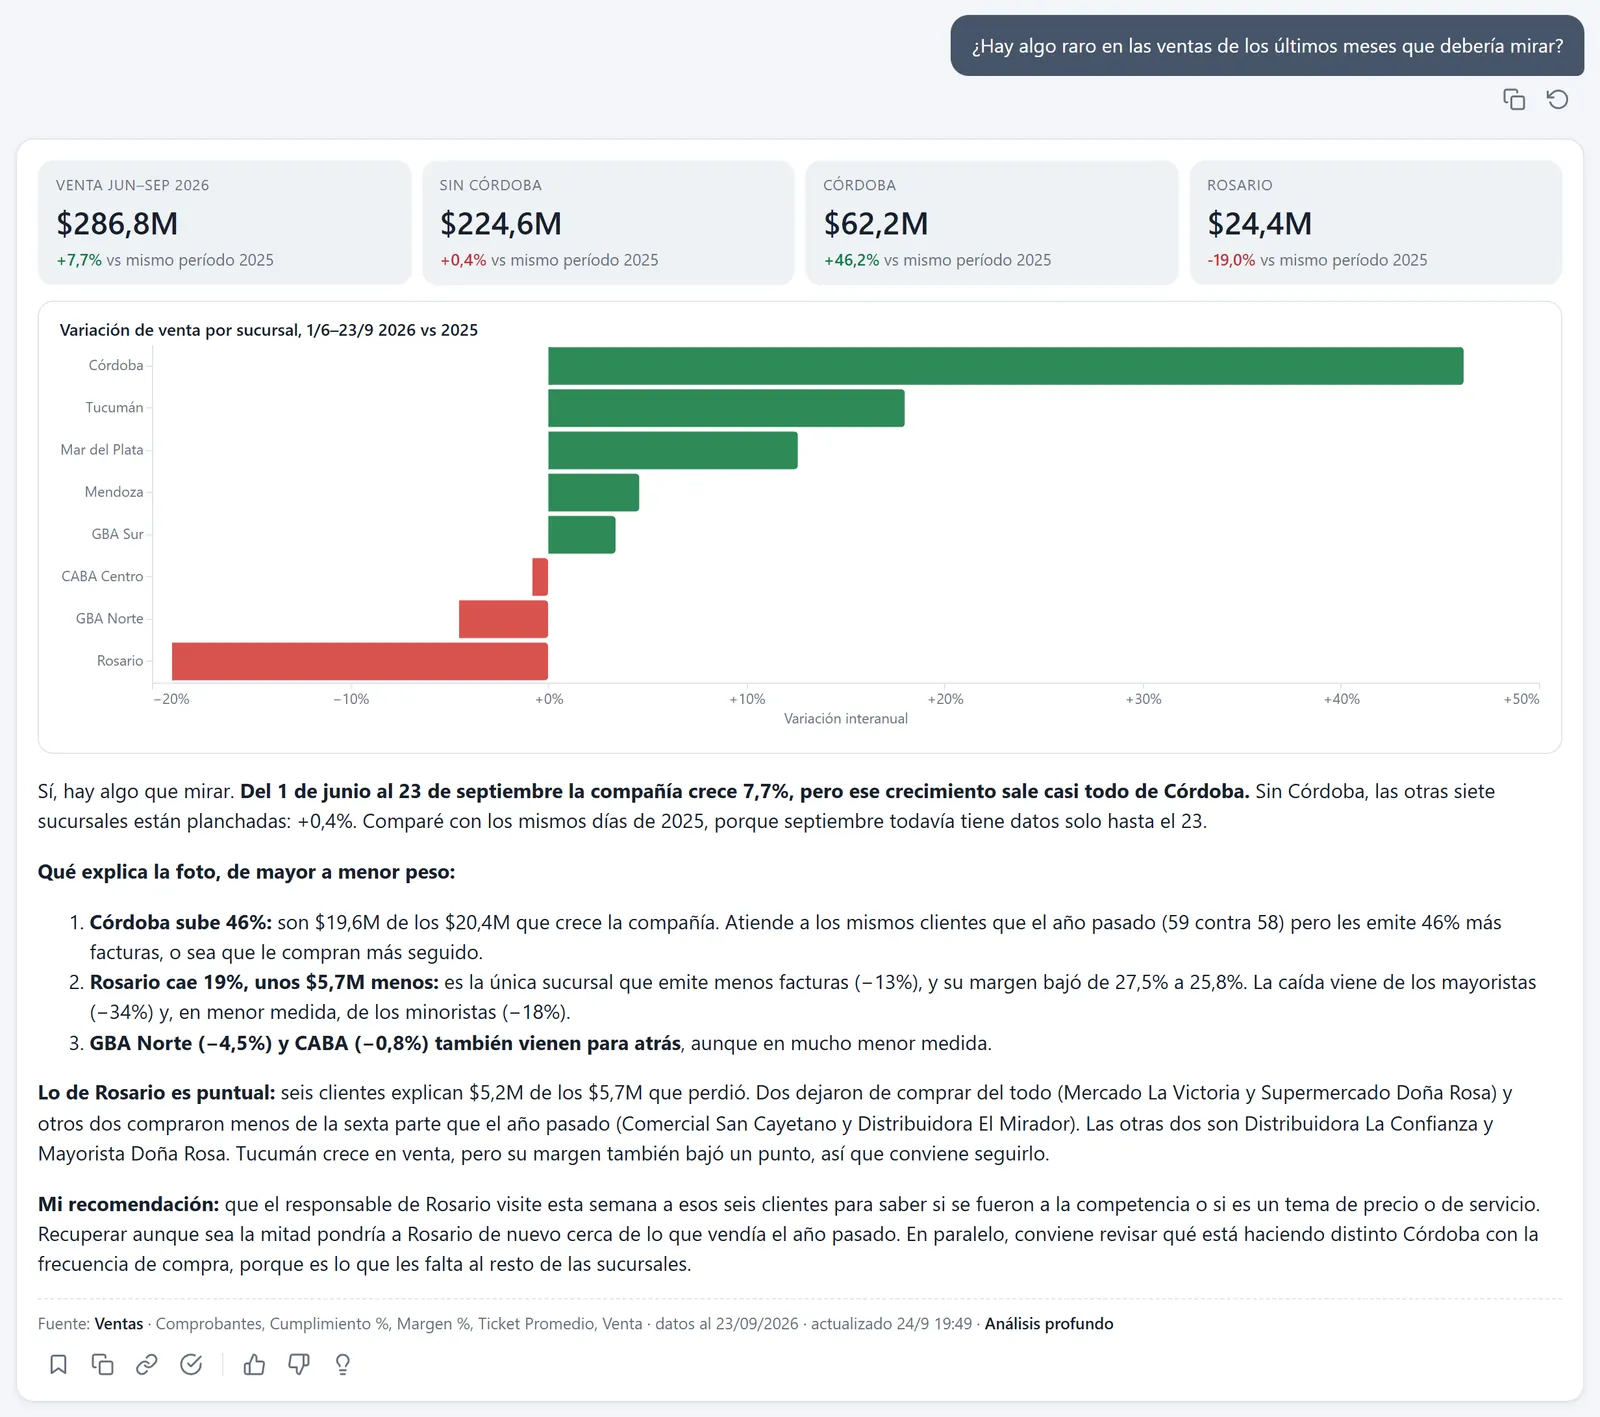
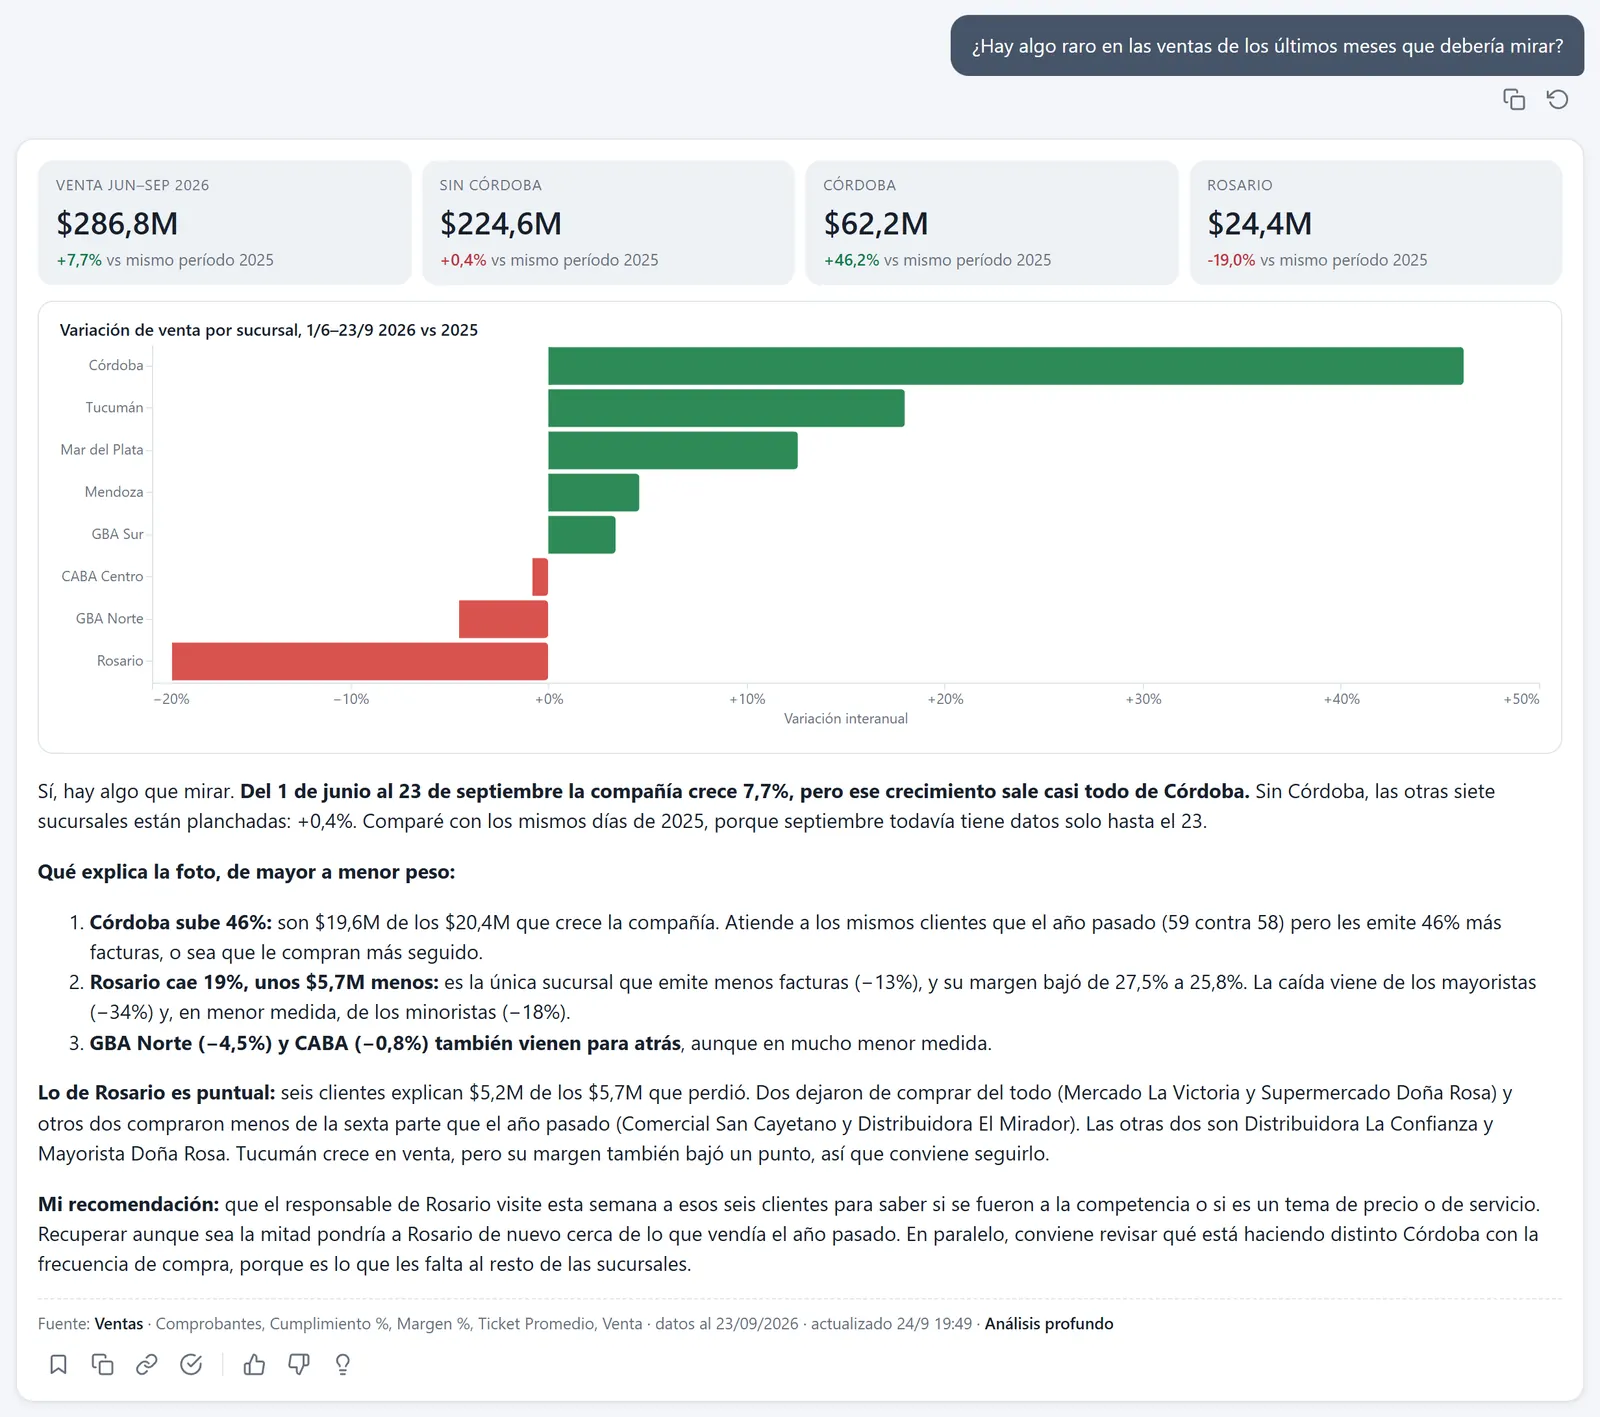
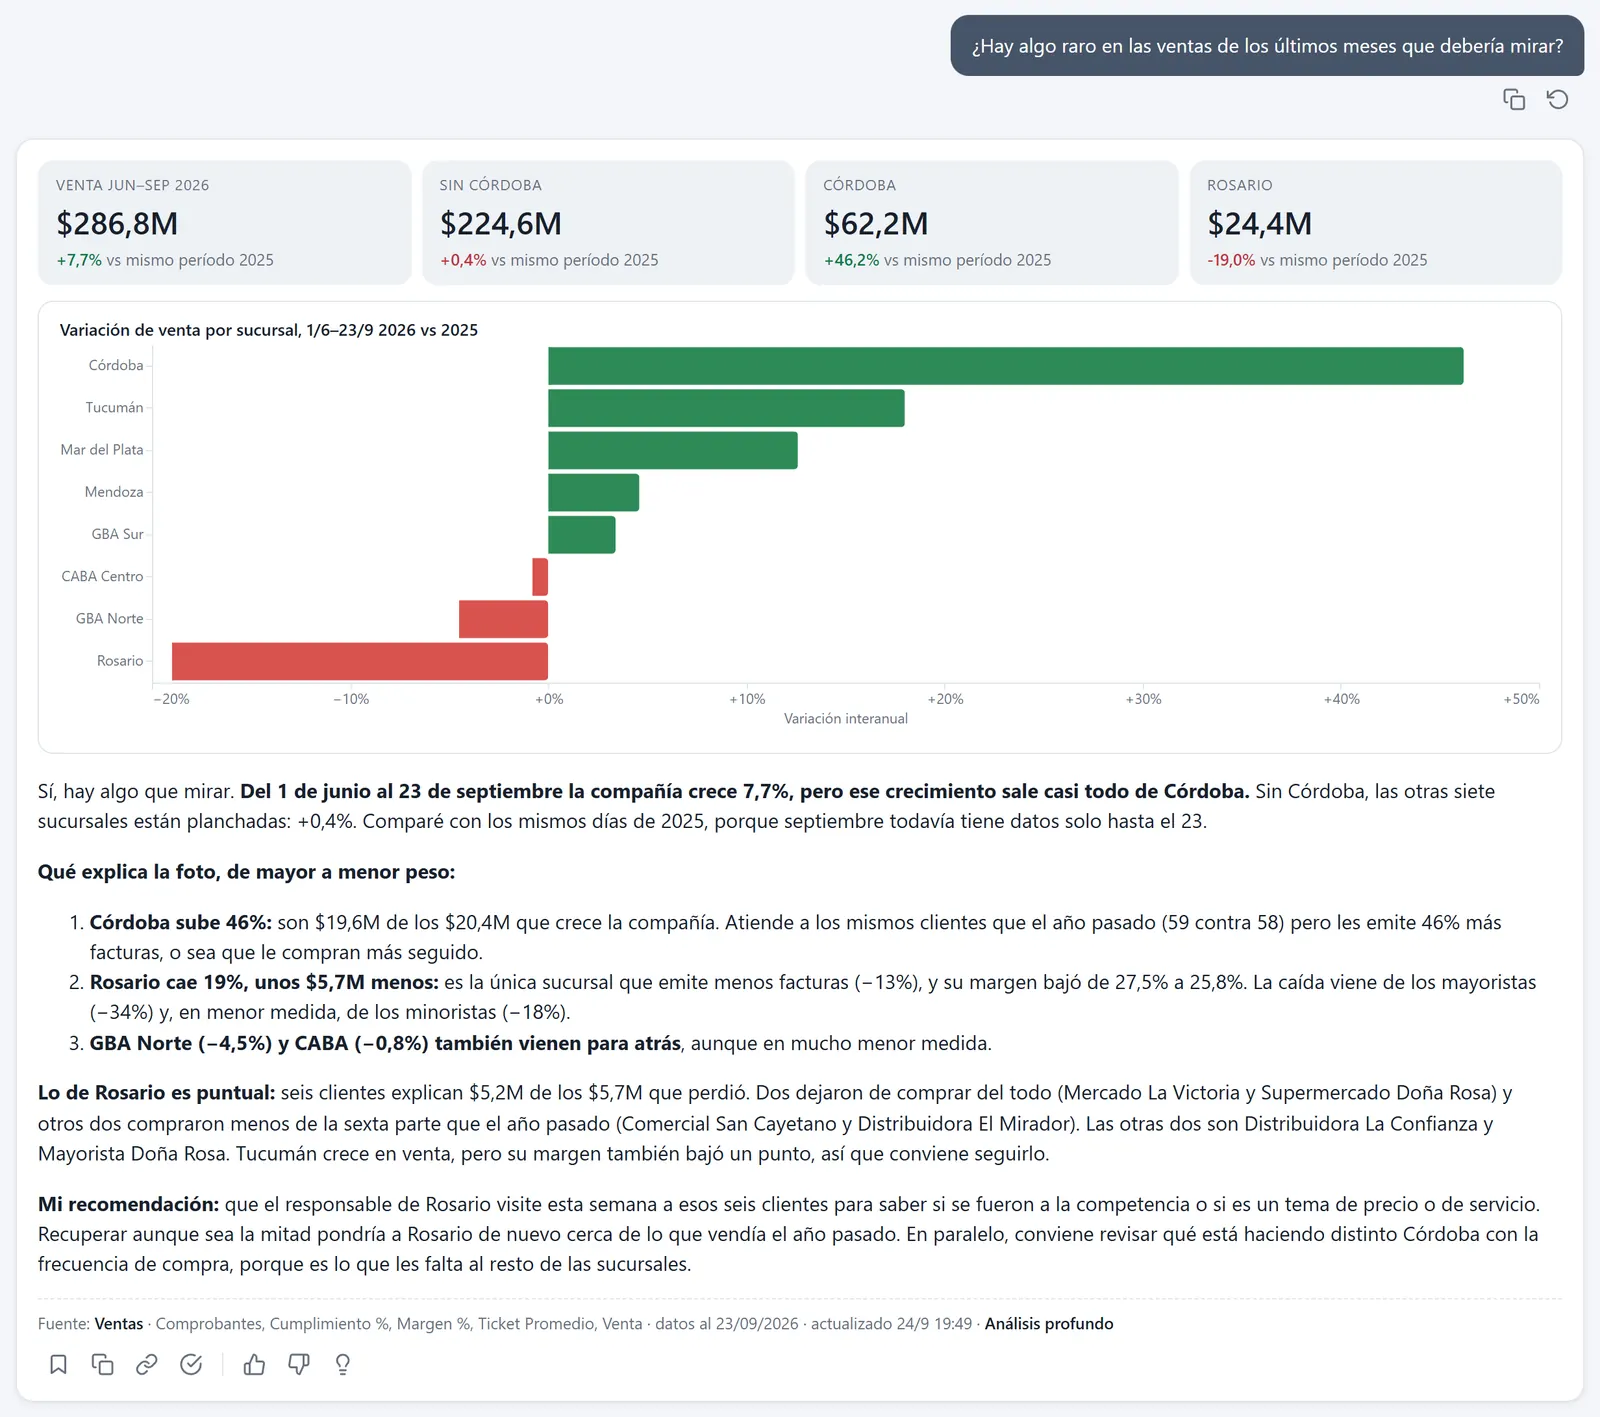
Right: the growth depends on Cordoba, Rosario has been down for months, and June and August came out flat.
And eleven more
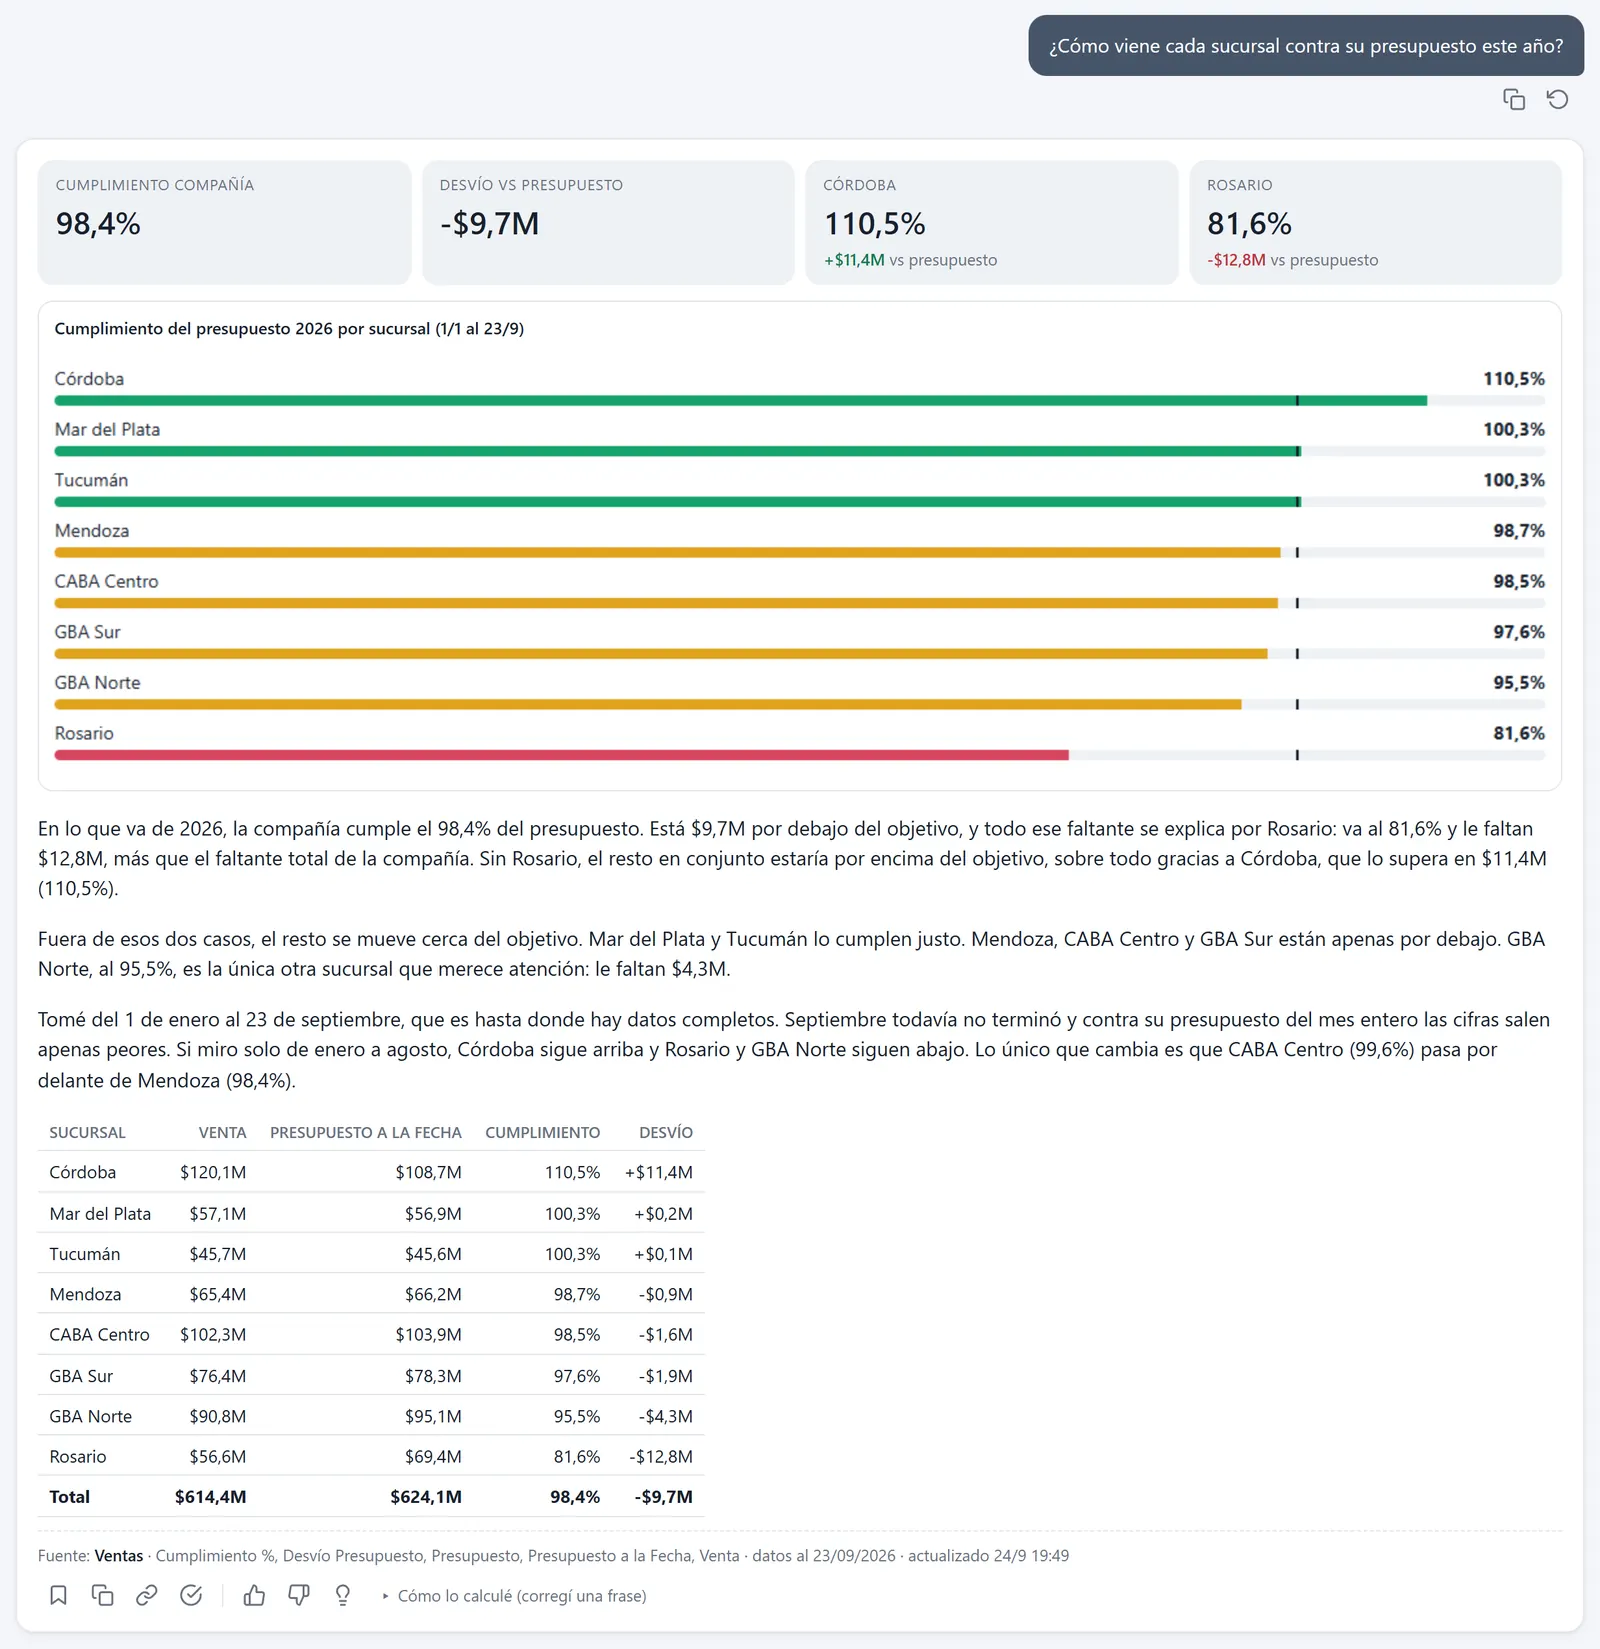
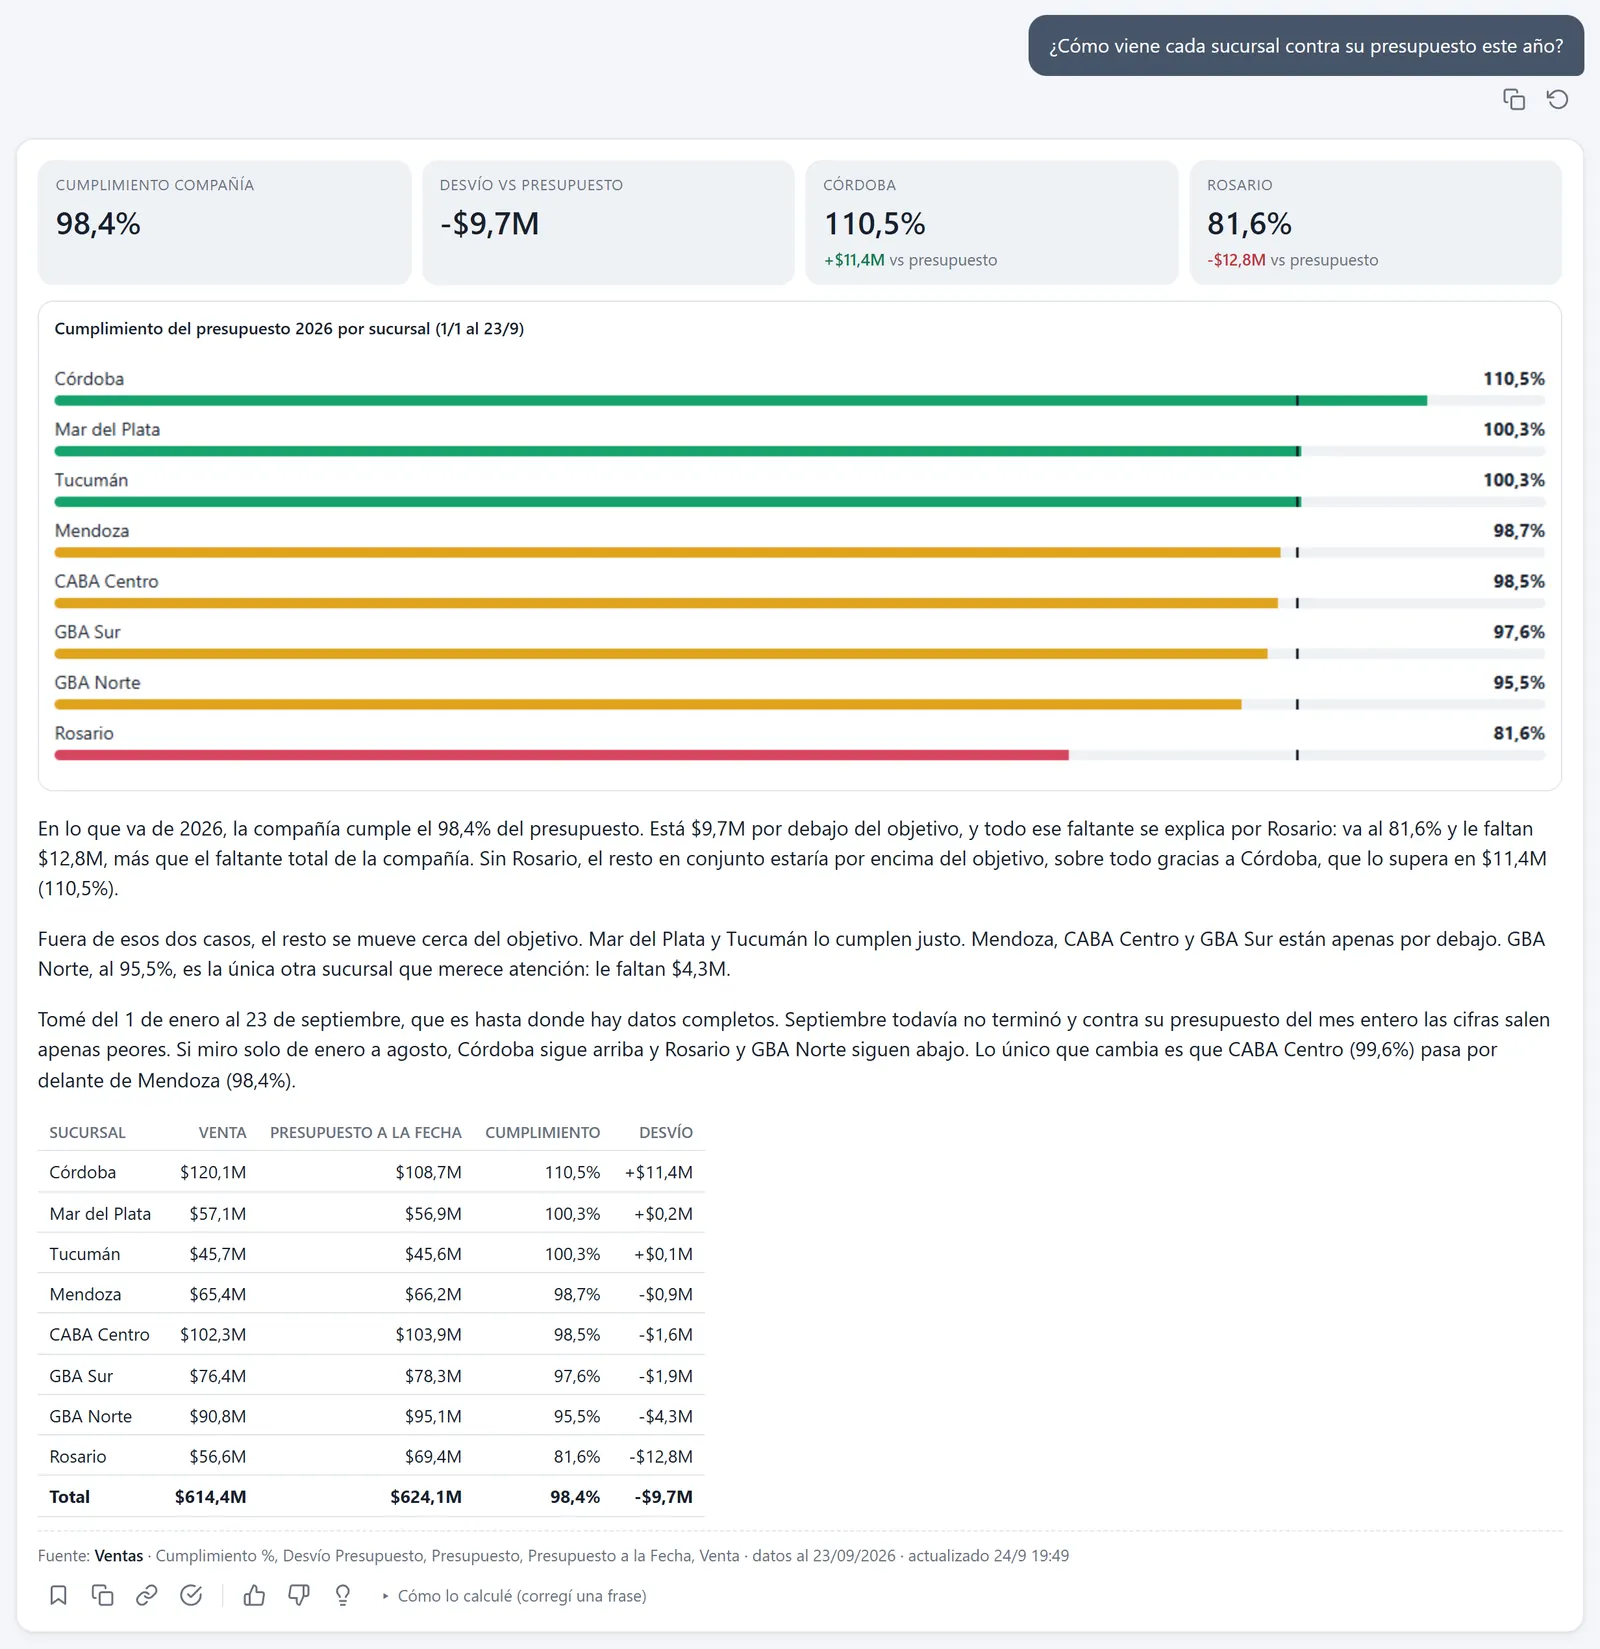
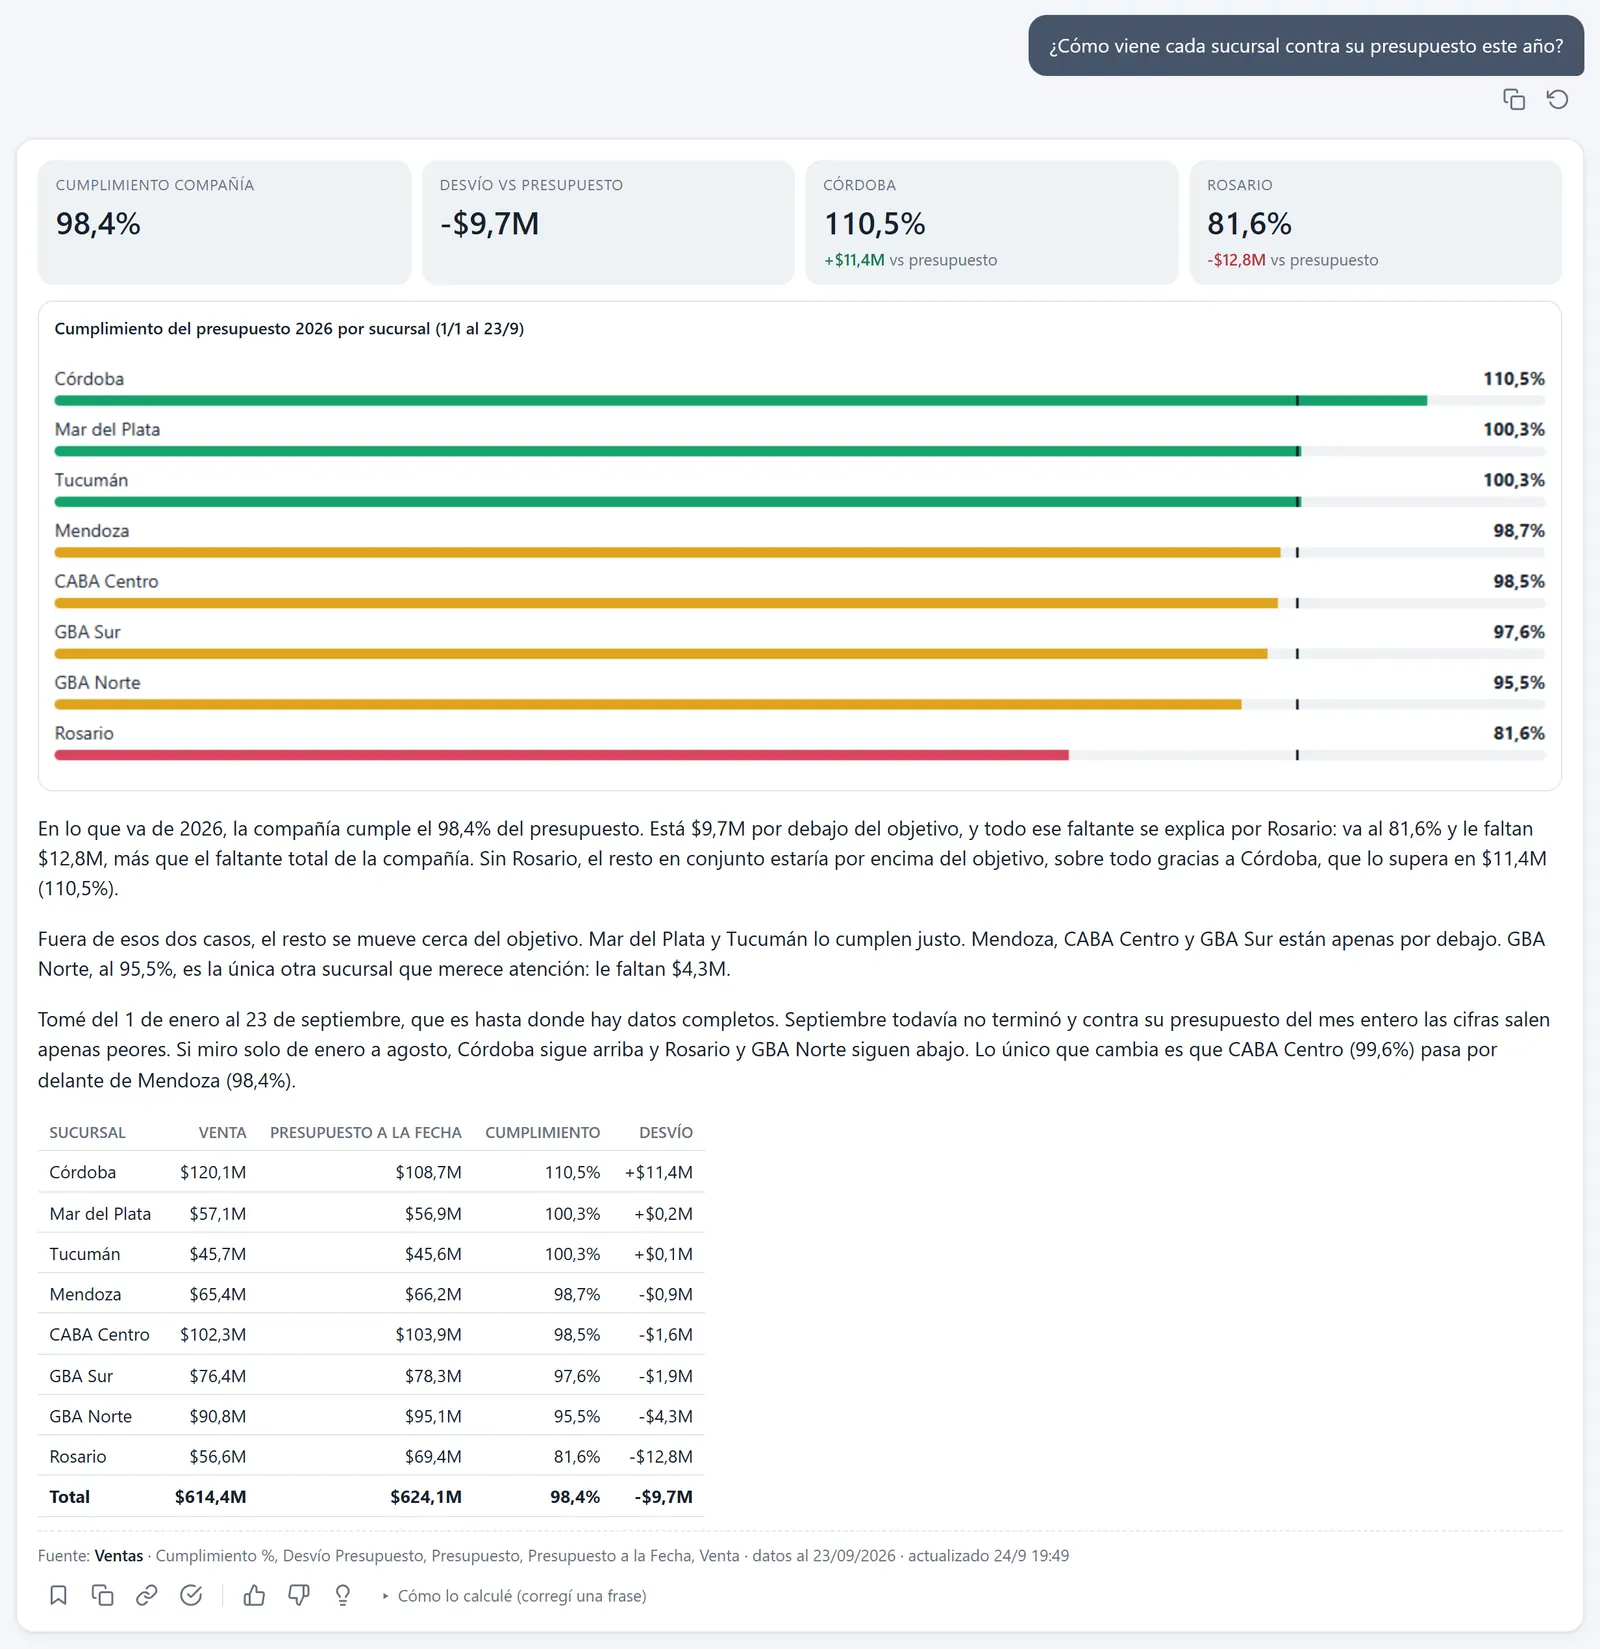
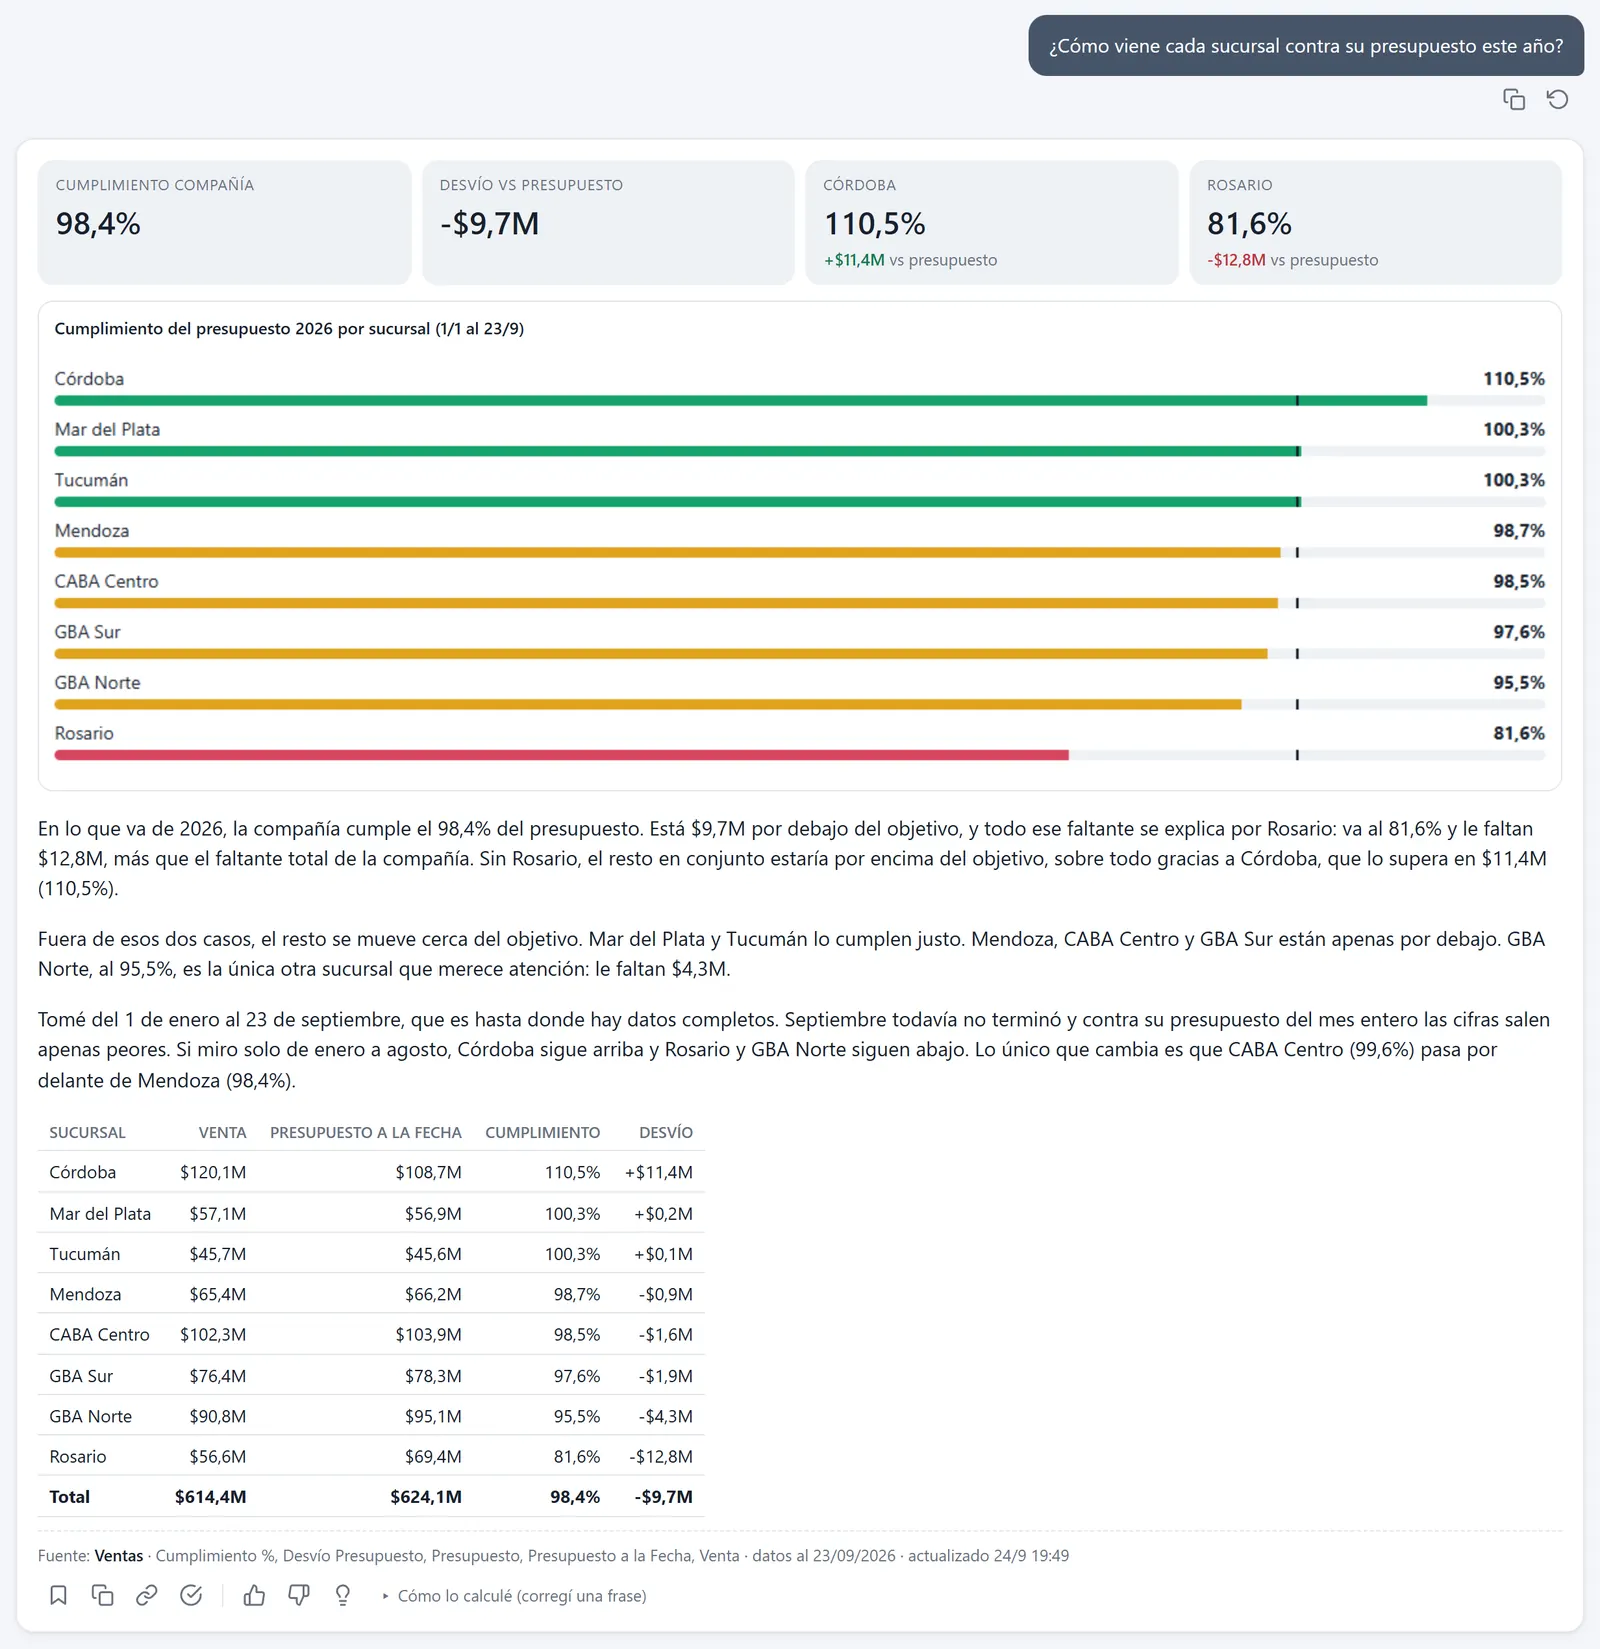
Right: the company is at 98.4%, $9.7M below. Rosario alone owes $12.8M, more than the entire shortfall: without Rosario, the rest together are above target, largely thanks to Cordoba.
98.4%, -$9.7M. "All of that shortfall is explained by Rosario… without Rosario, the rest would be above target, largely thanks to Cordoba."
The table is right, but it puts both readings together: "Cordoba offsets almost all of it, and Rosario explains most of the gap."
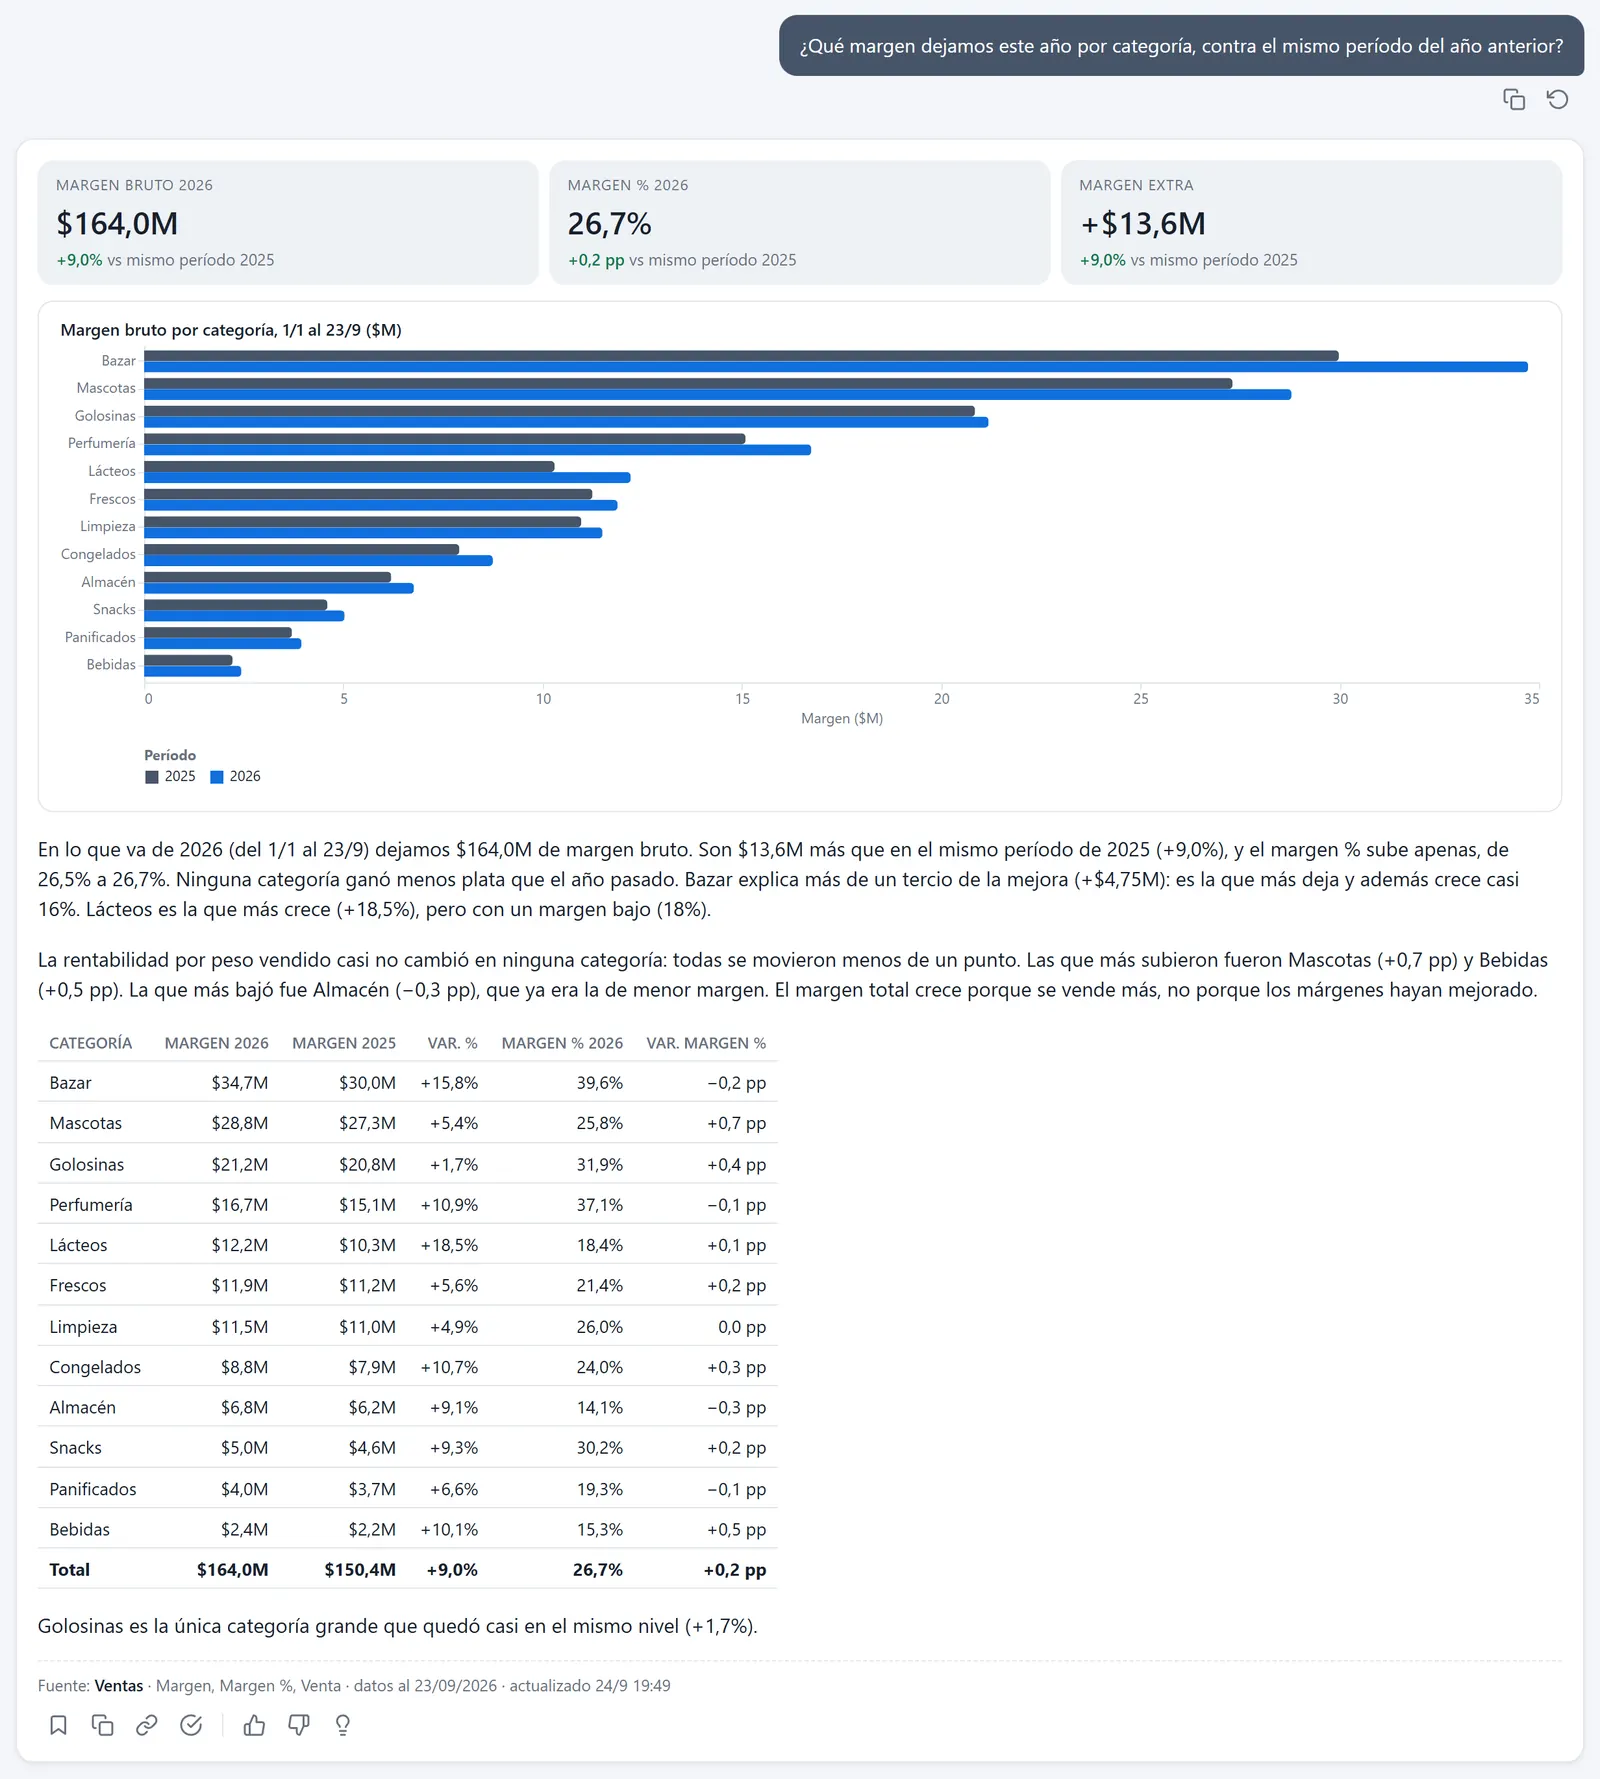
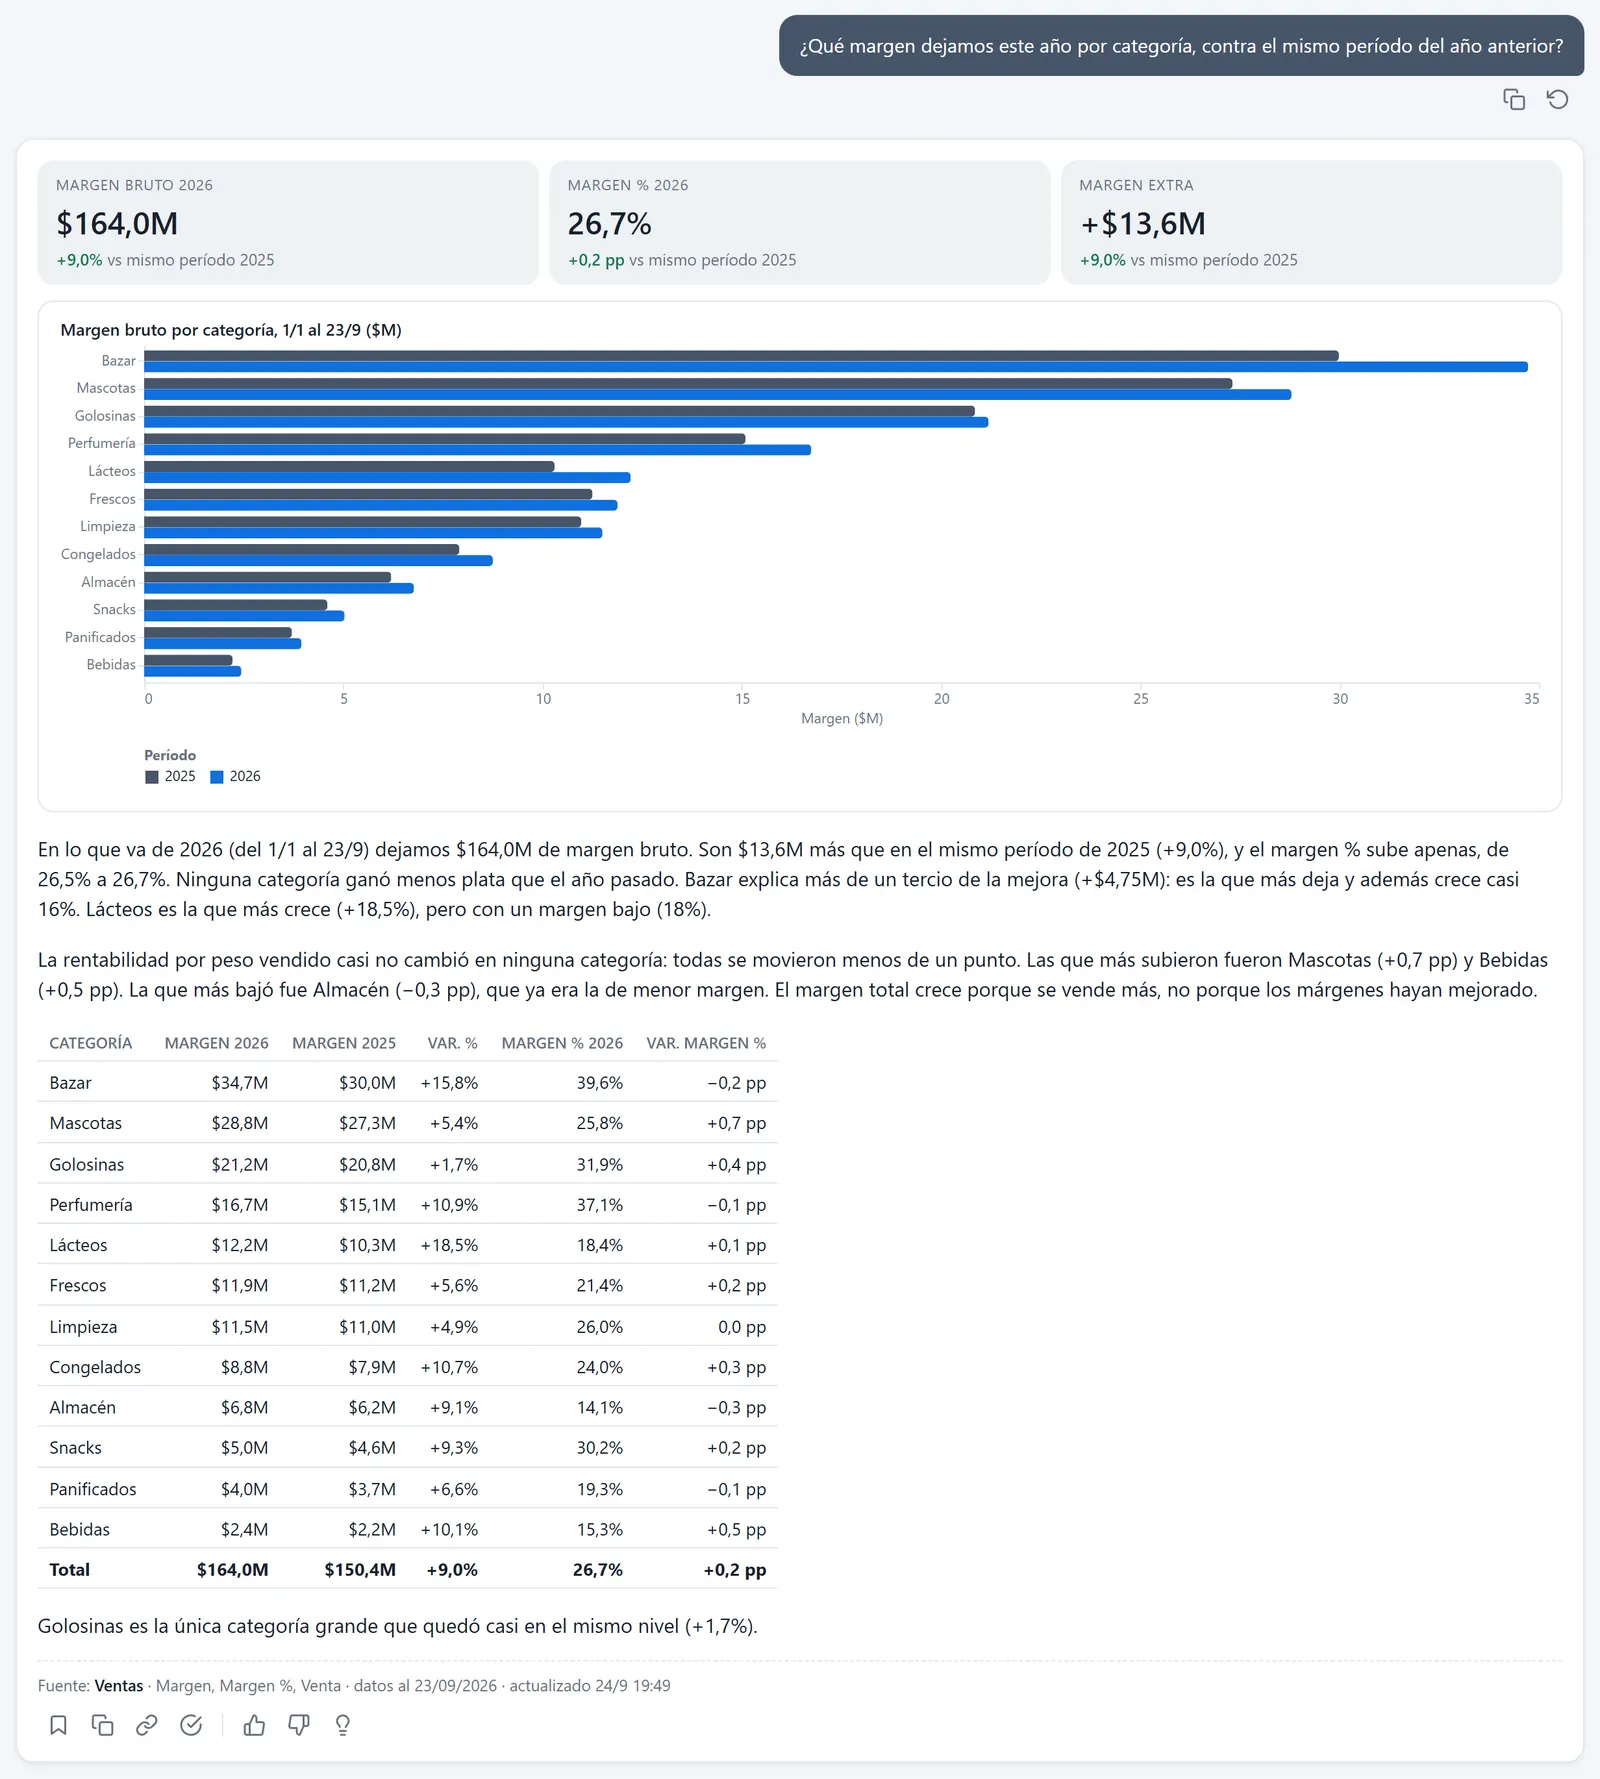
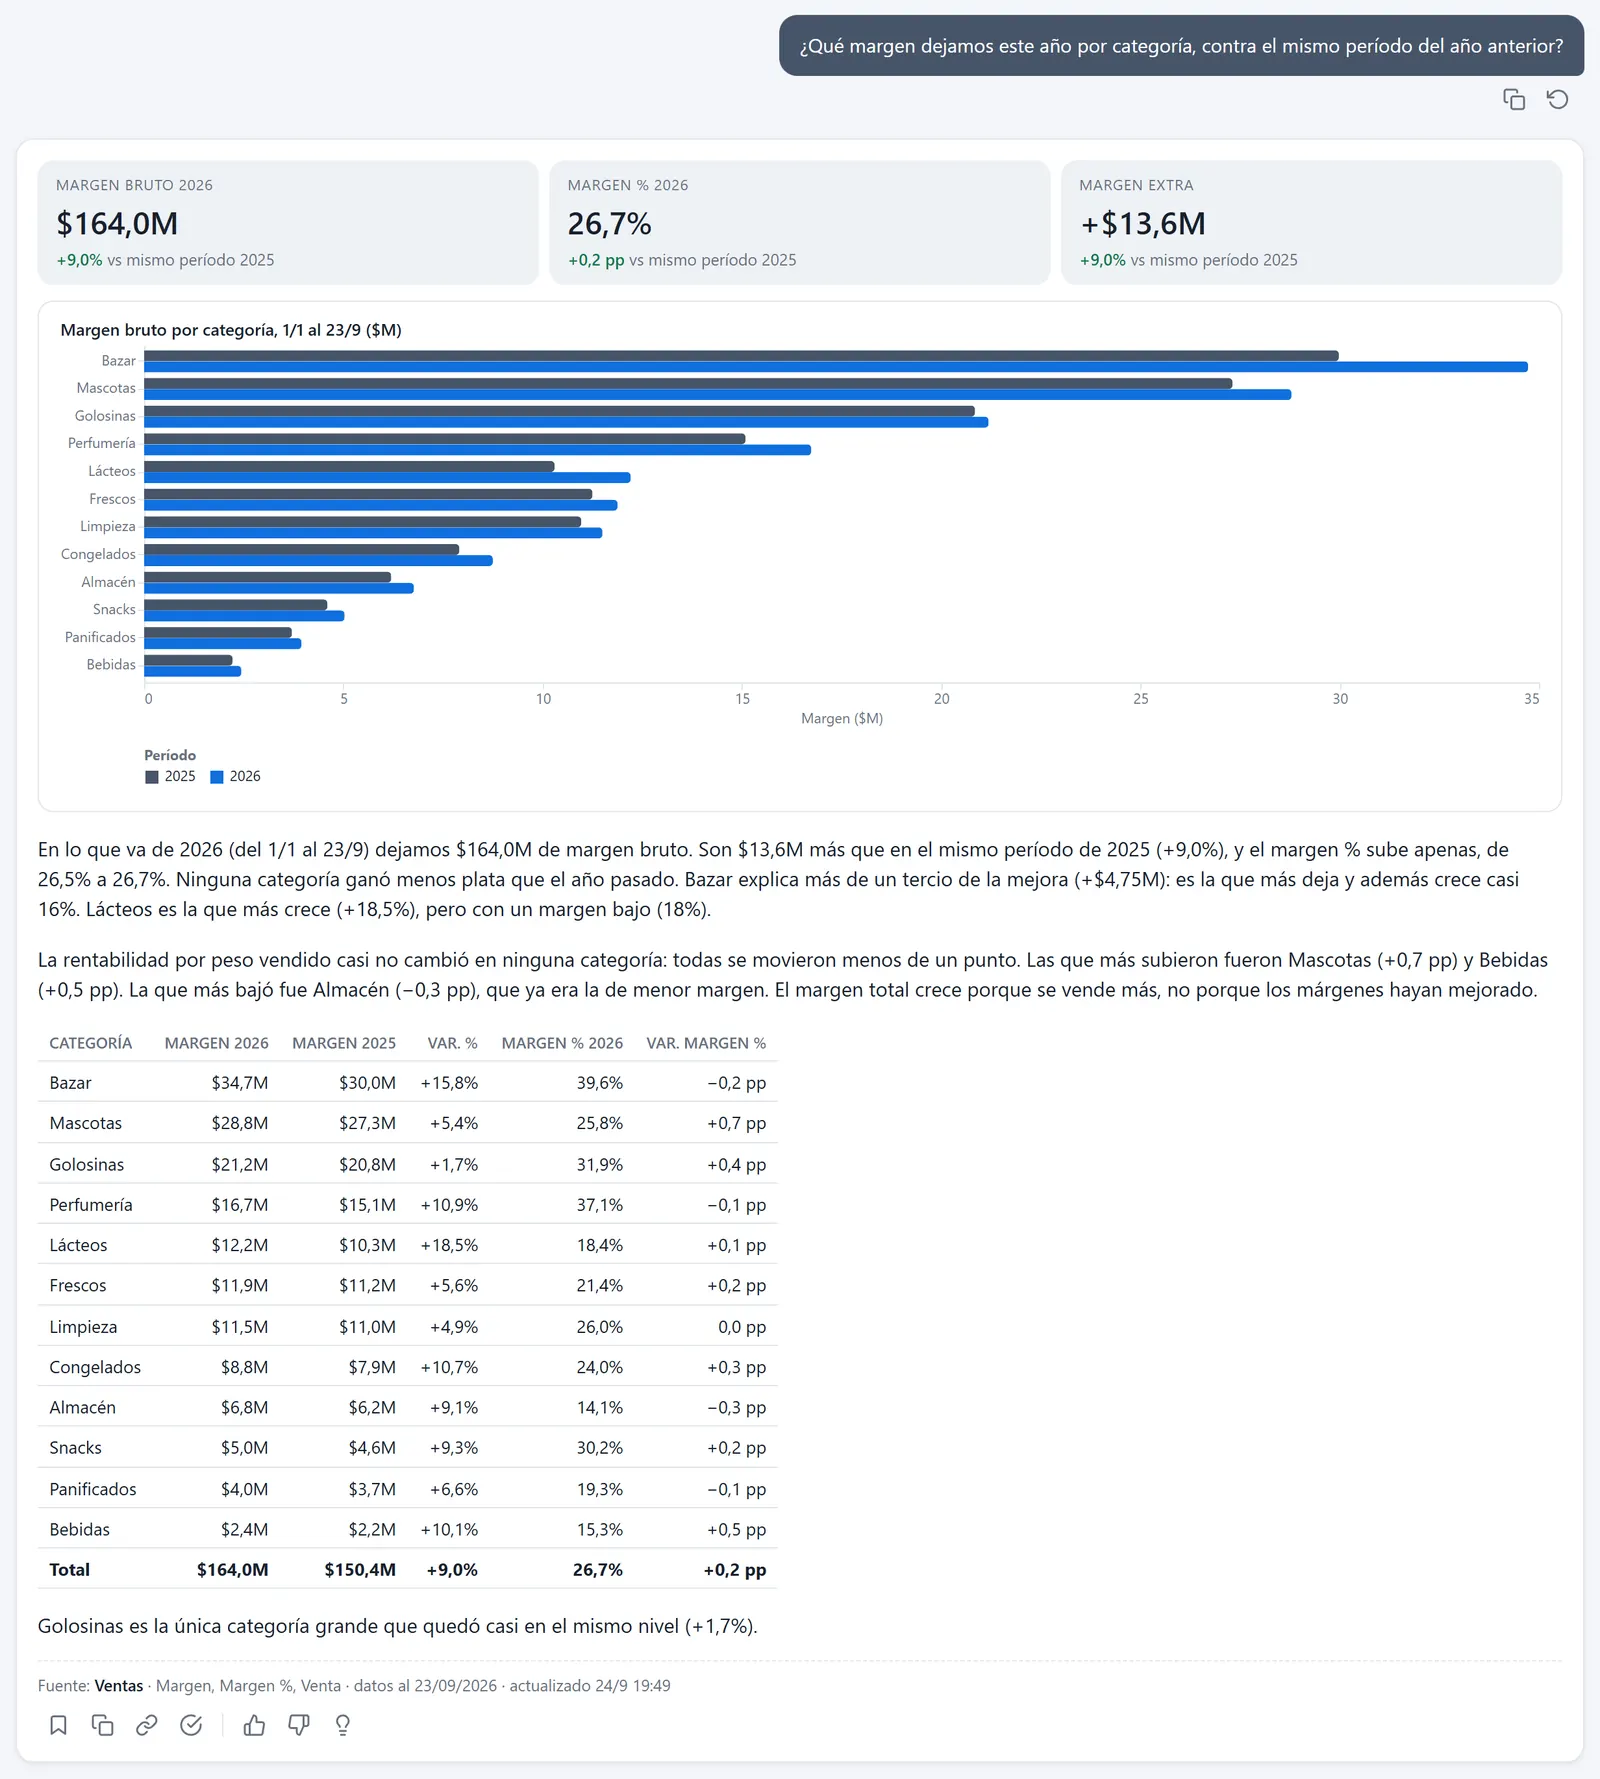
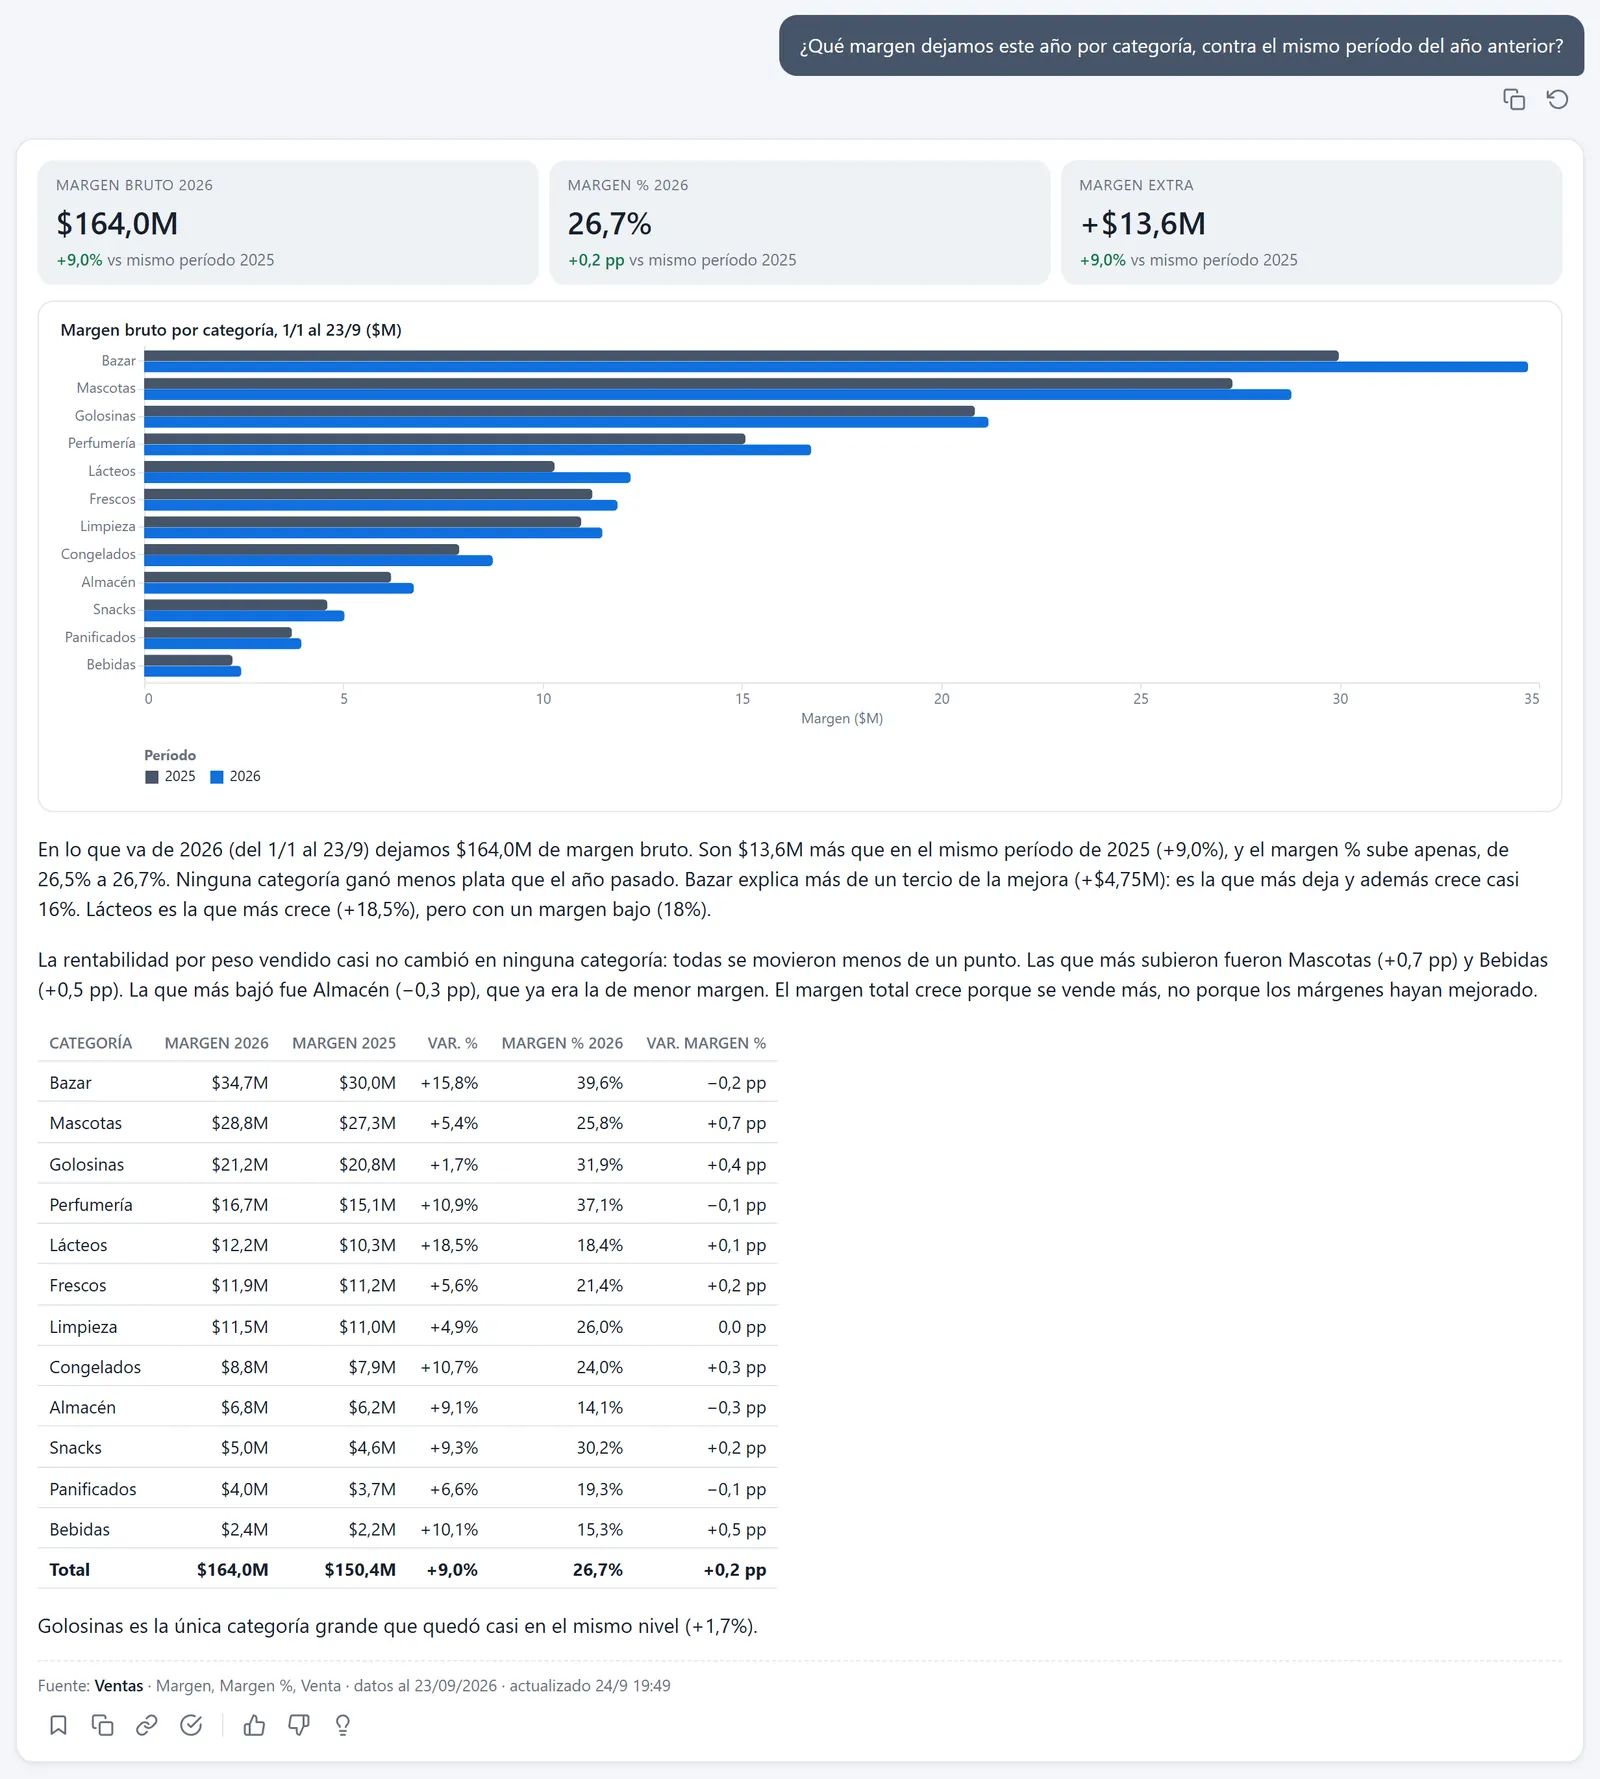
Right: margin is down in five categories and up in the rest.
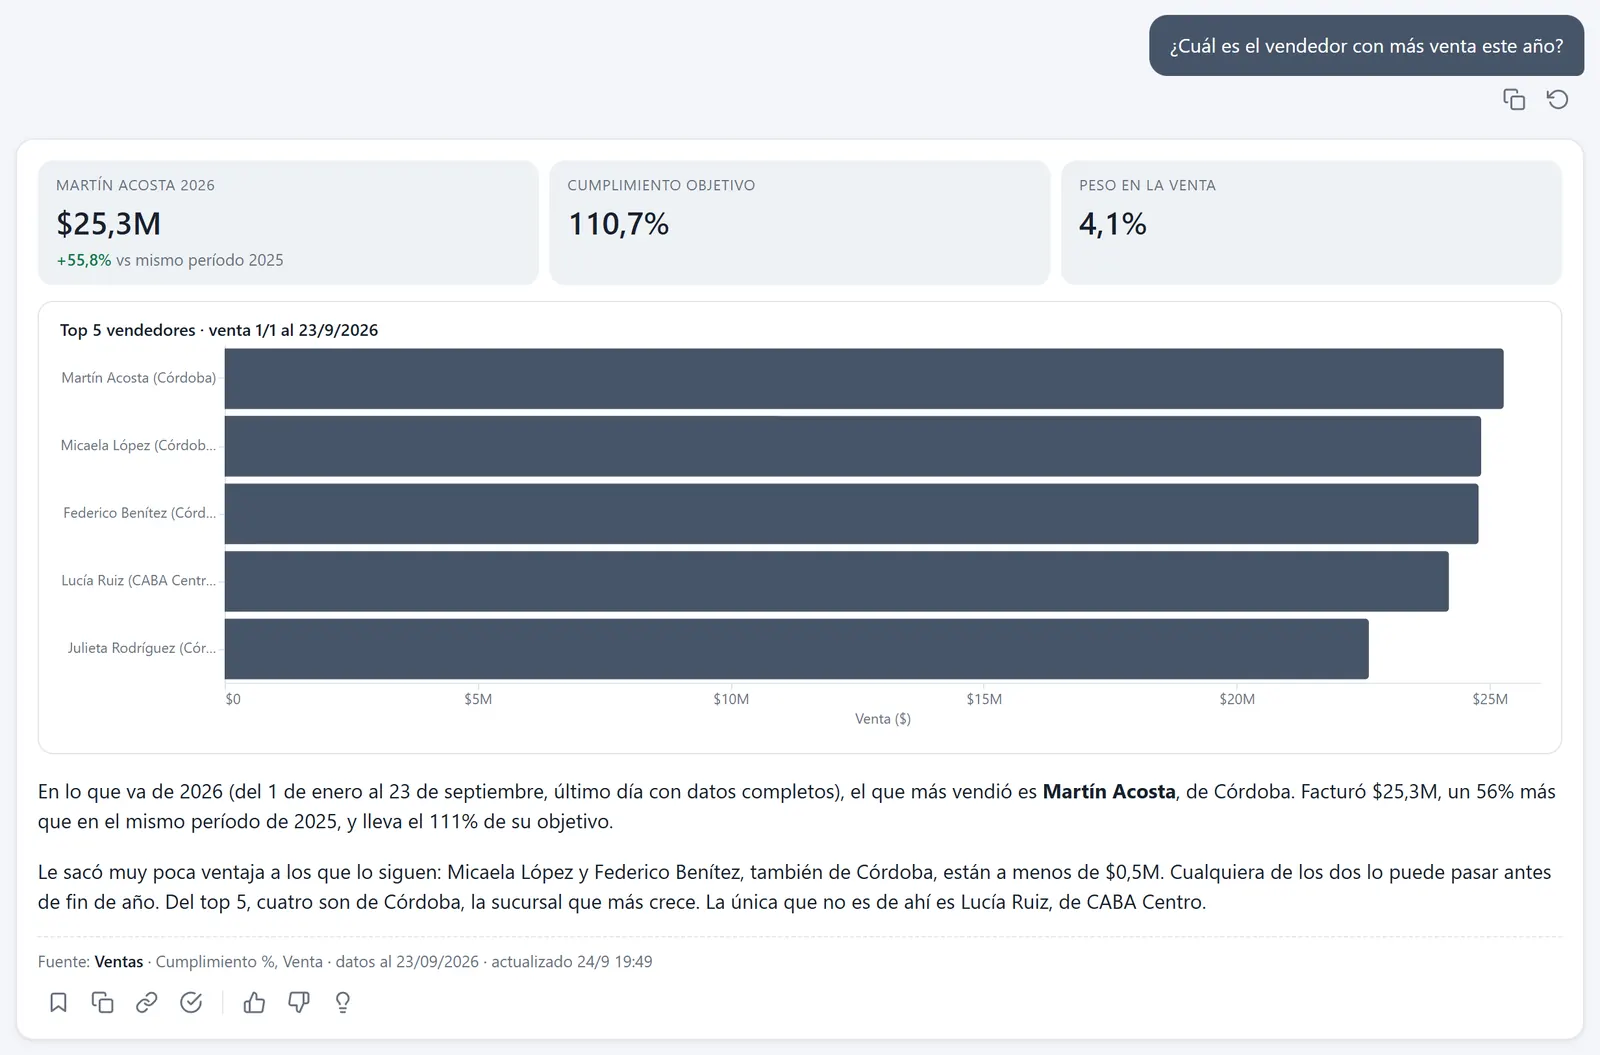
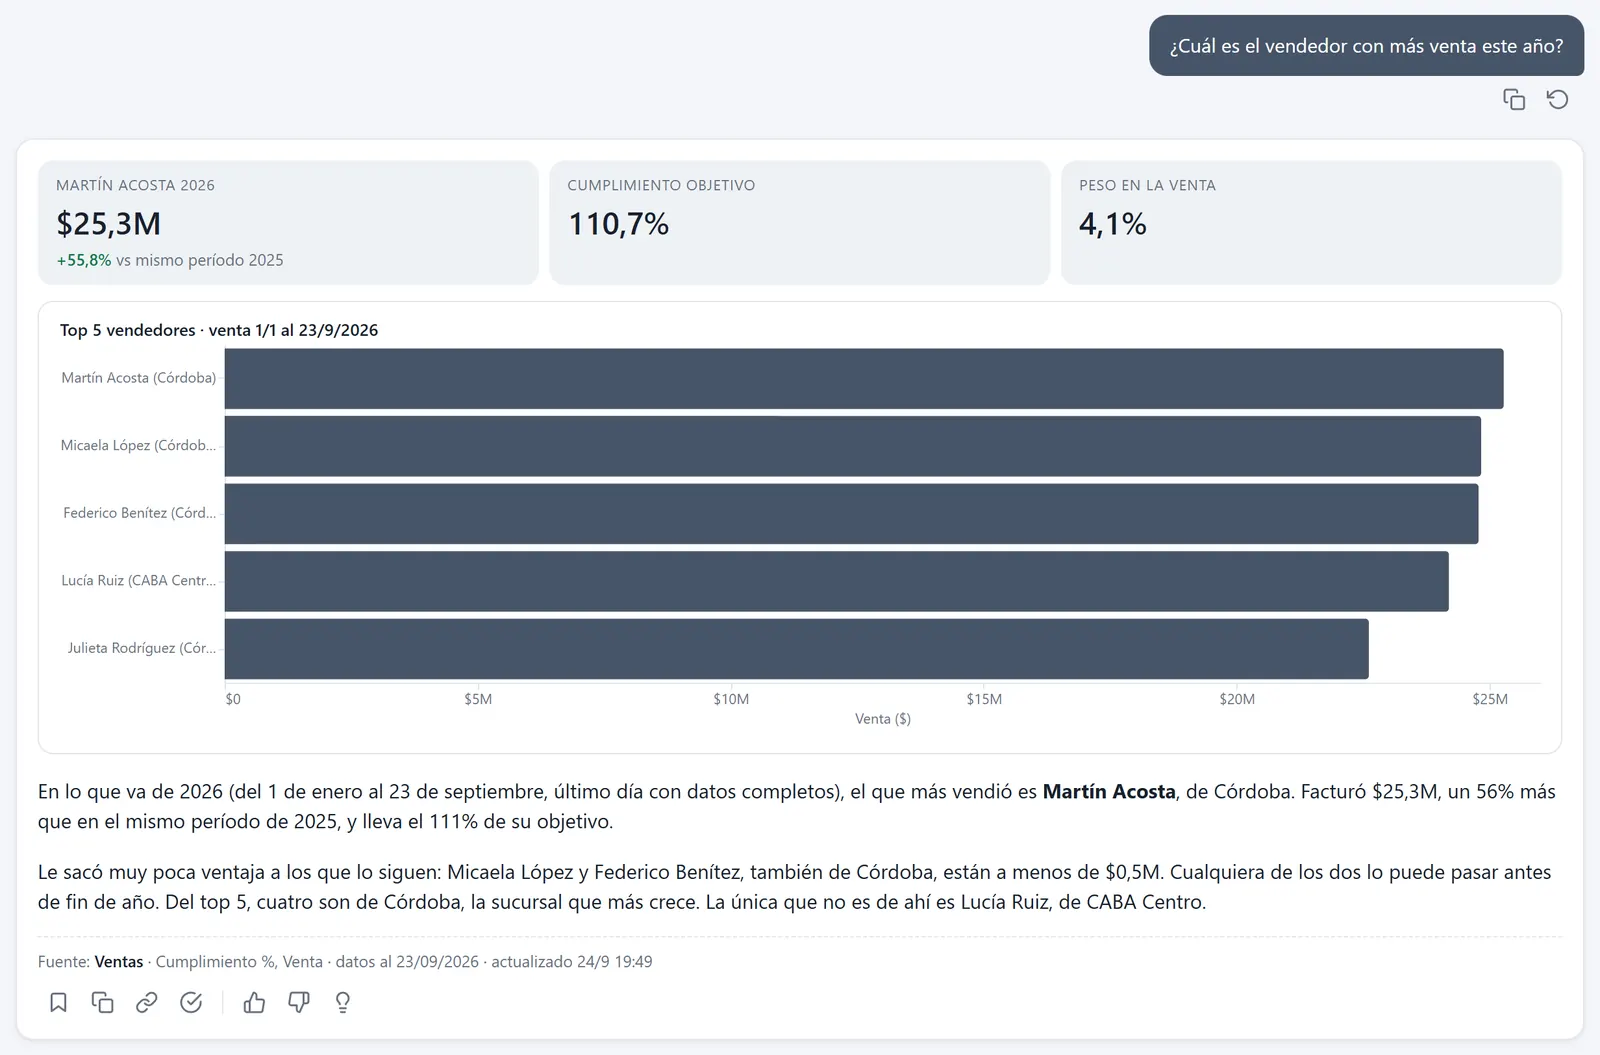
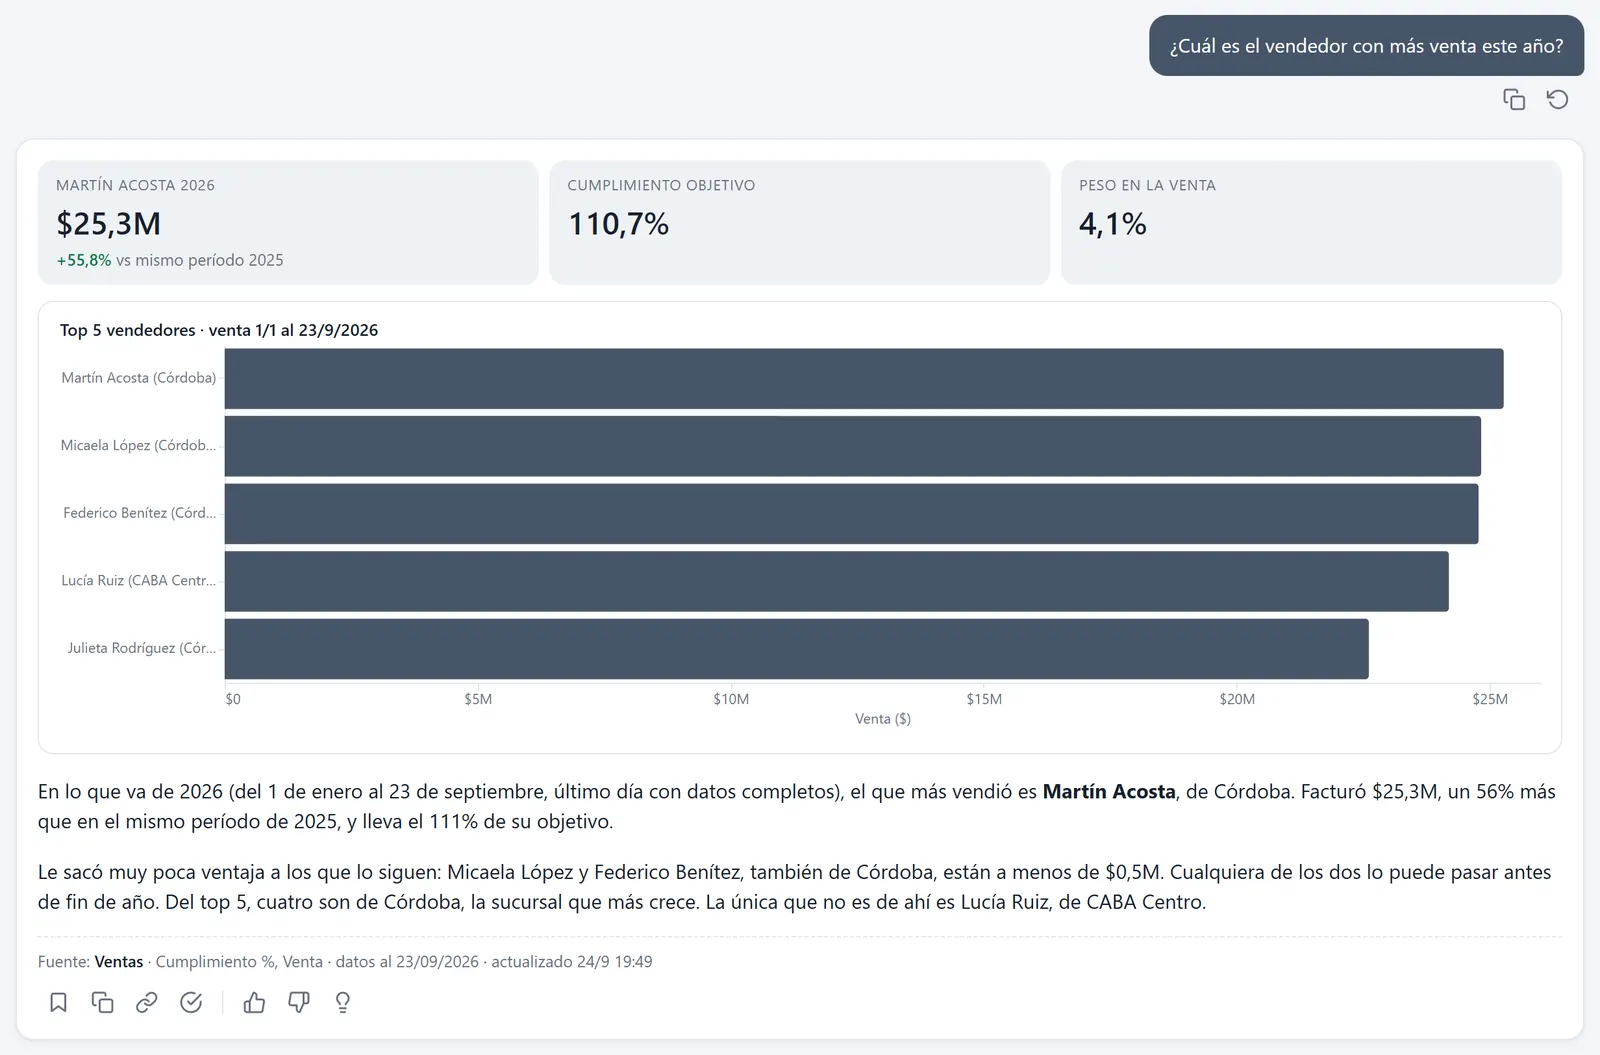
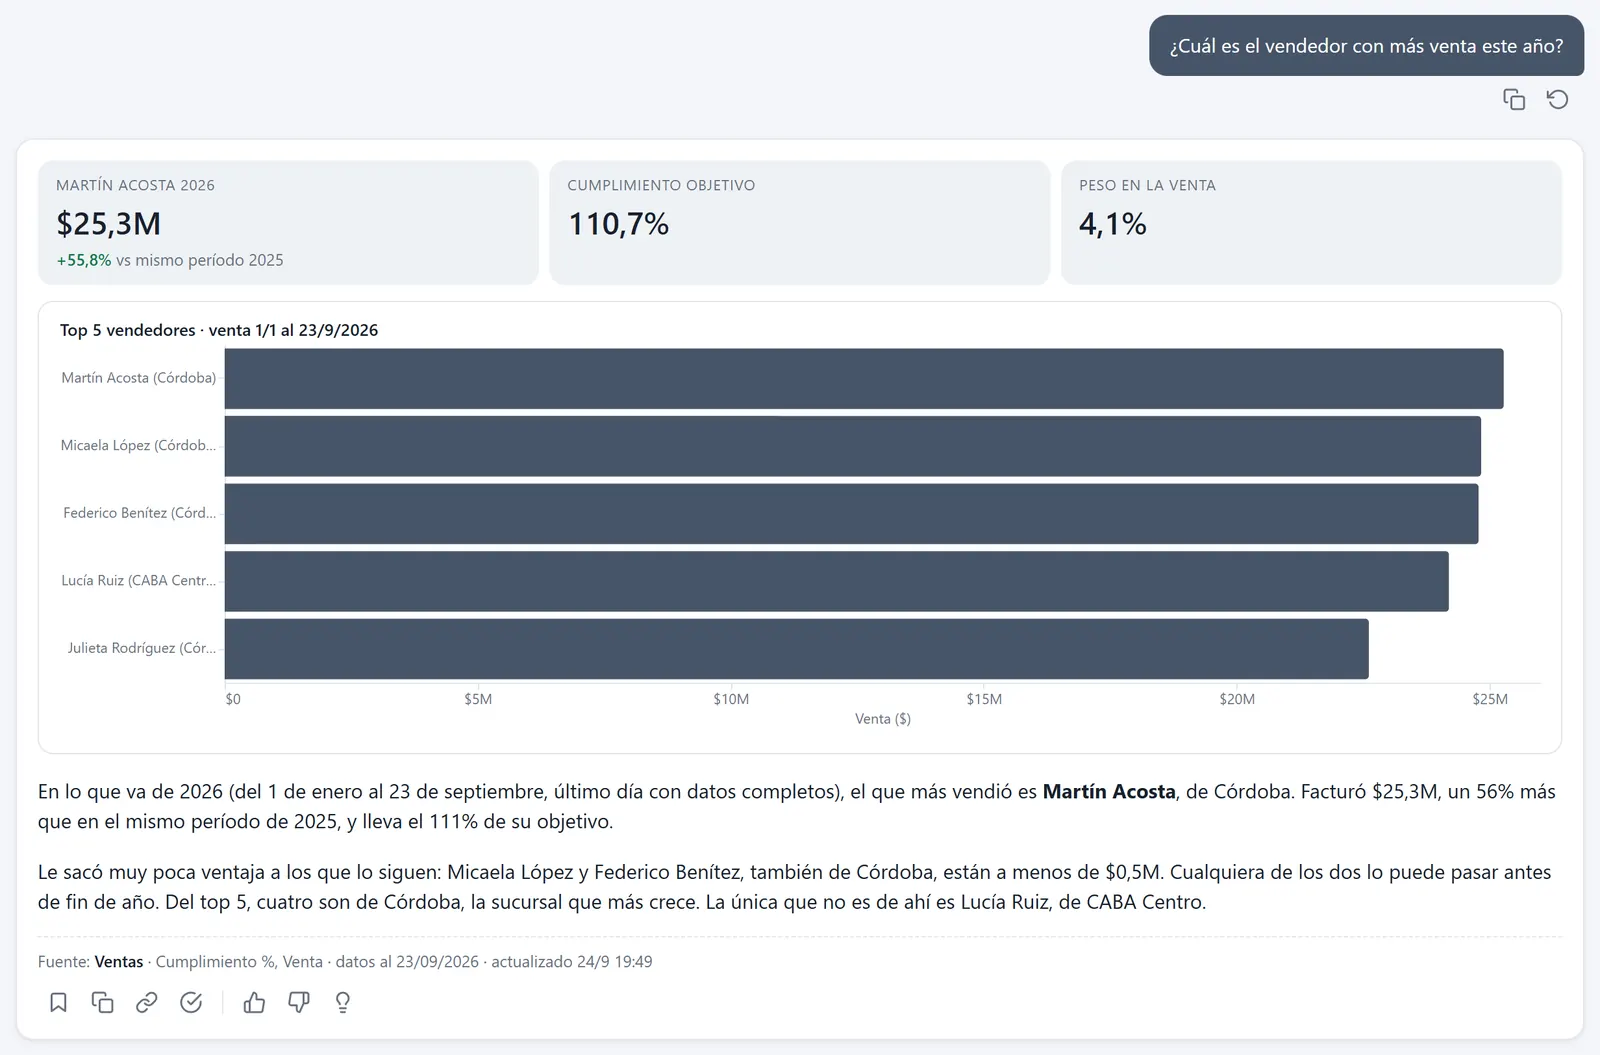
Right: Martin Acosta, $25.3M. The next two are within 2%.
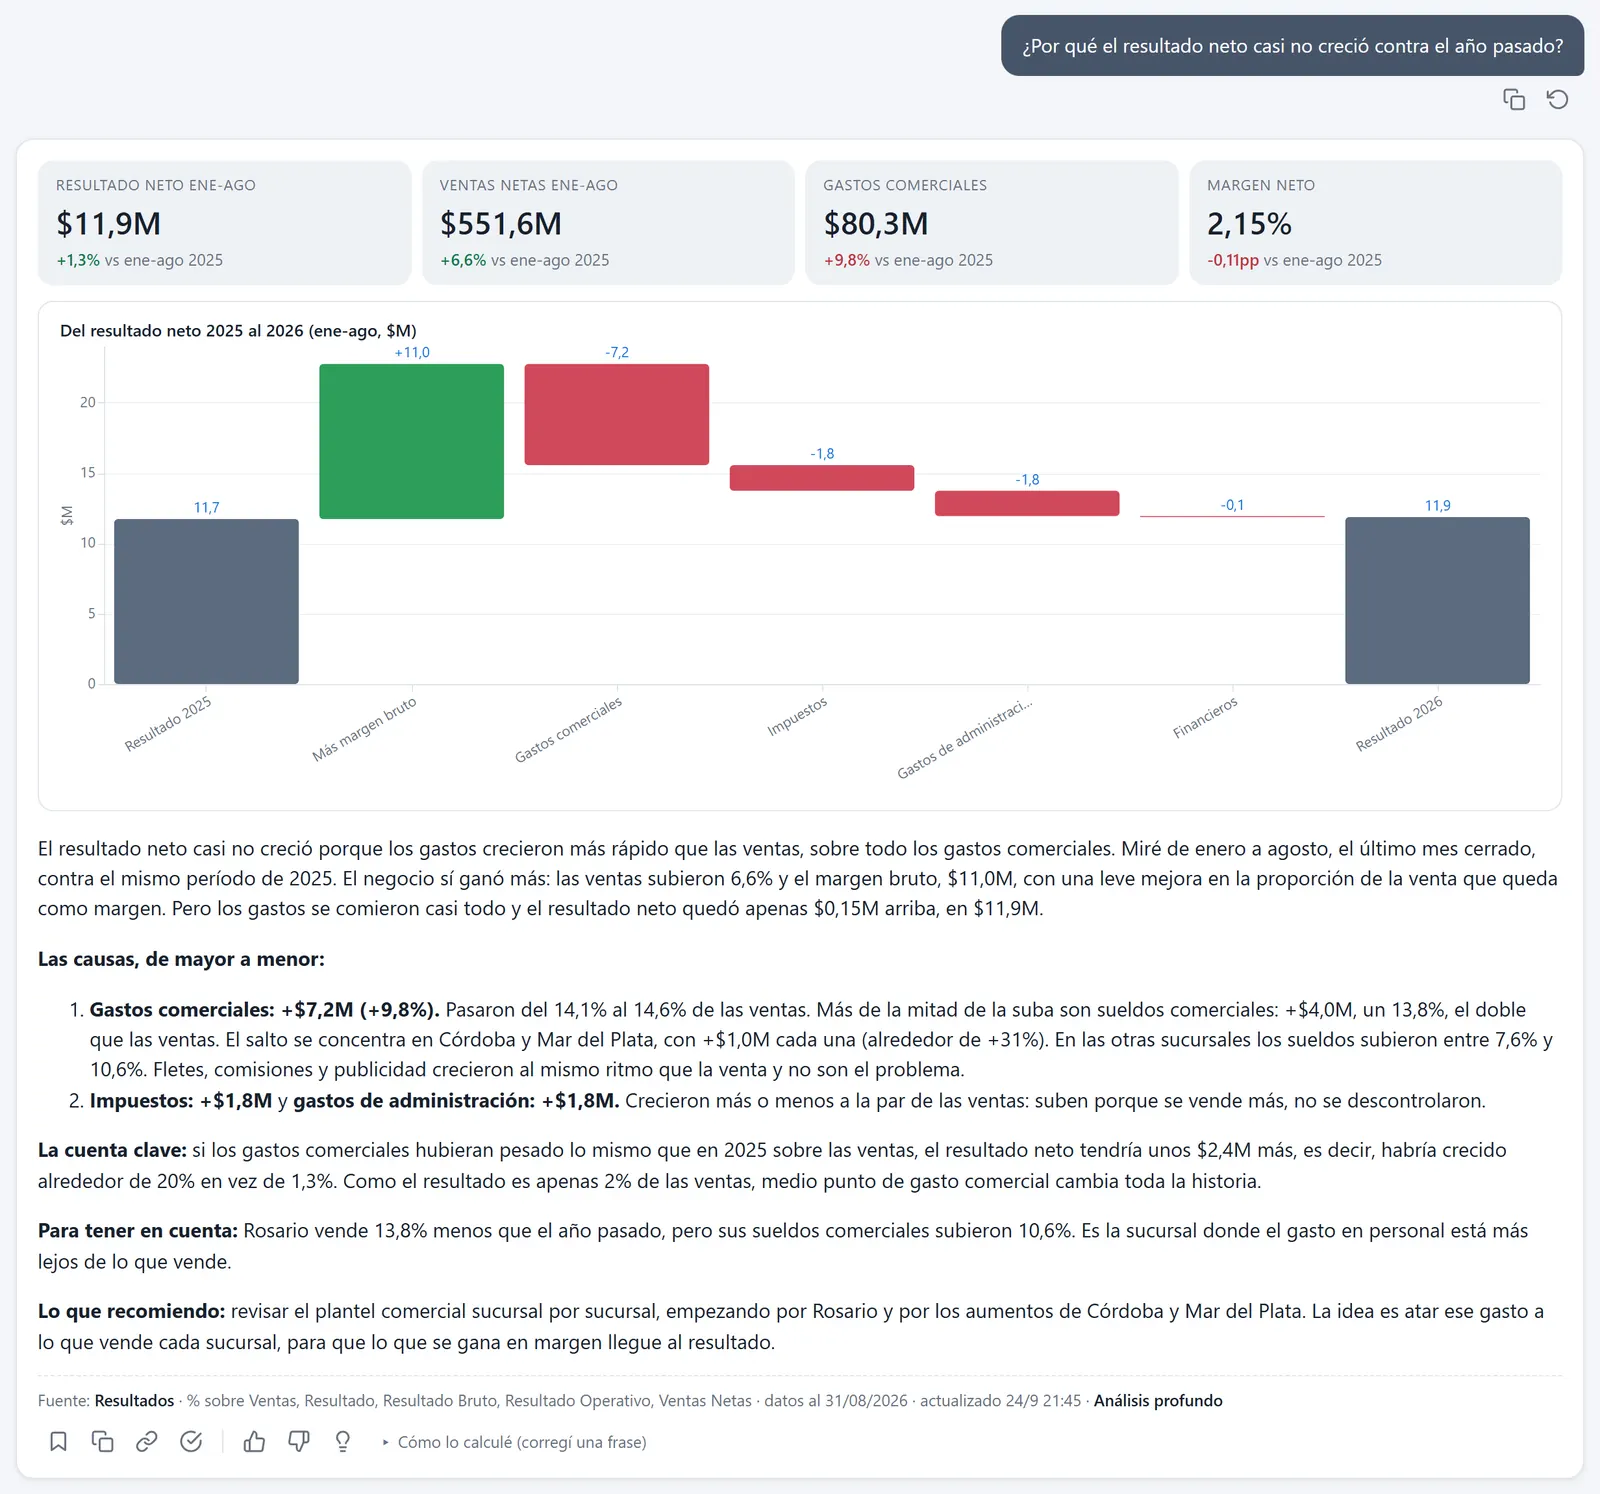
Right: it came out almost the same, about $11.9M. Sales grew, but margin on sales shrank.
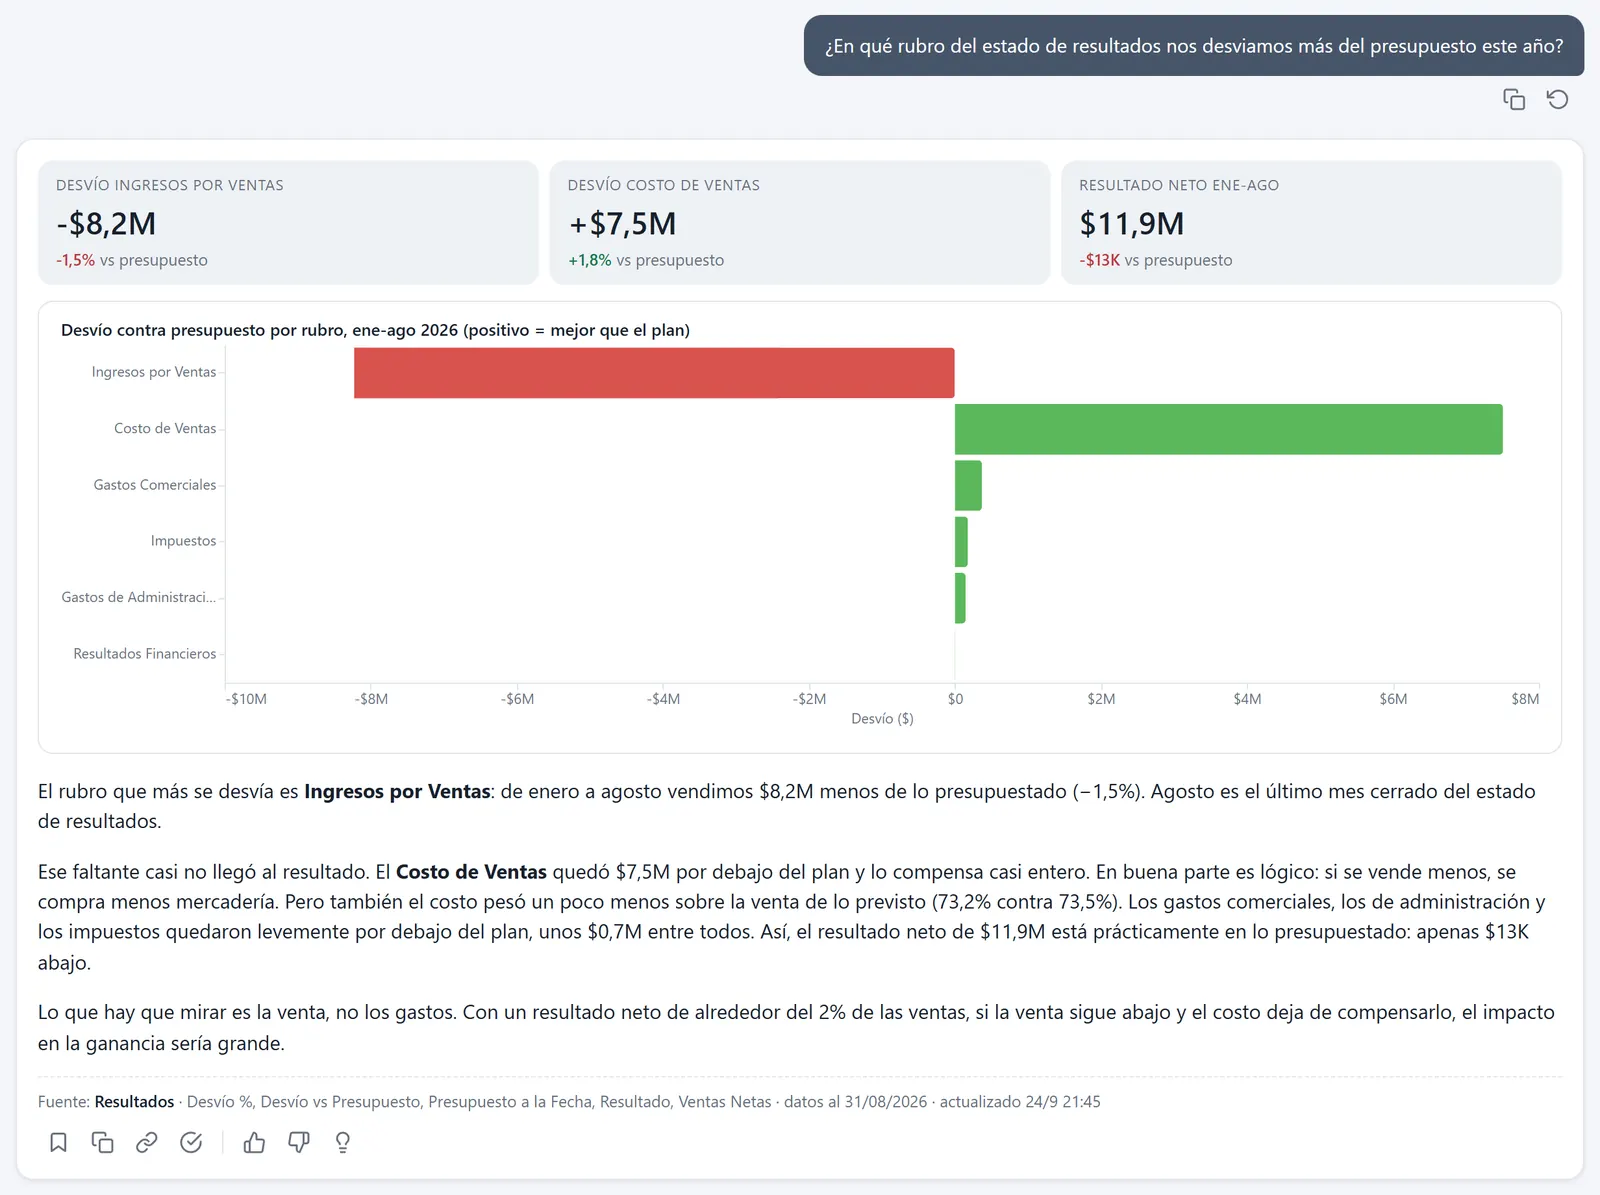
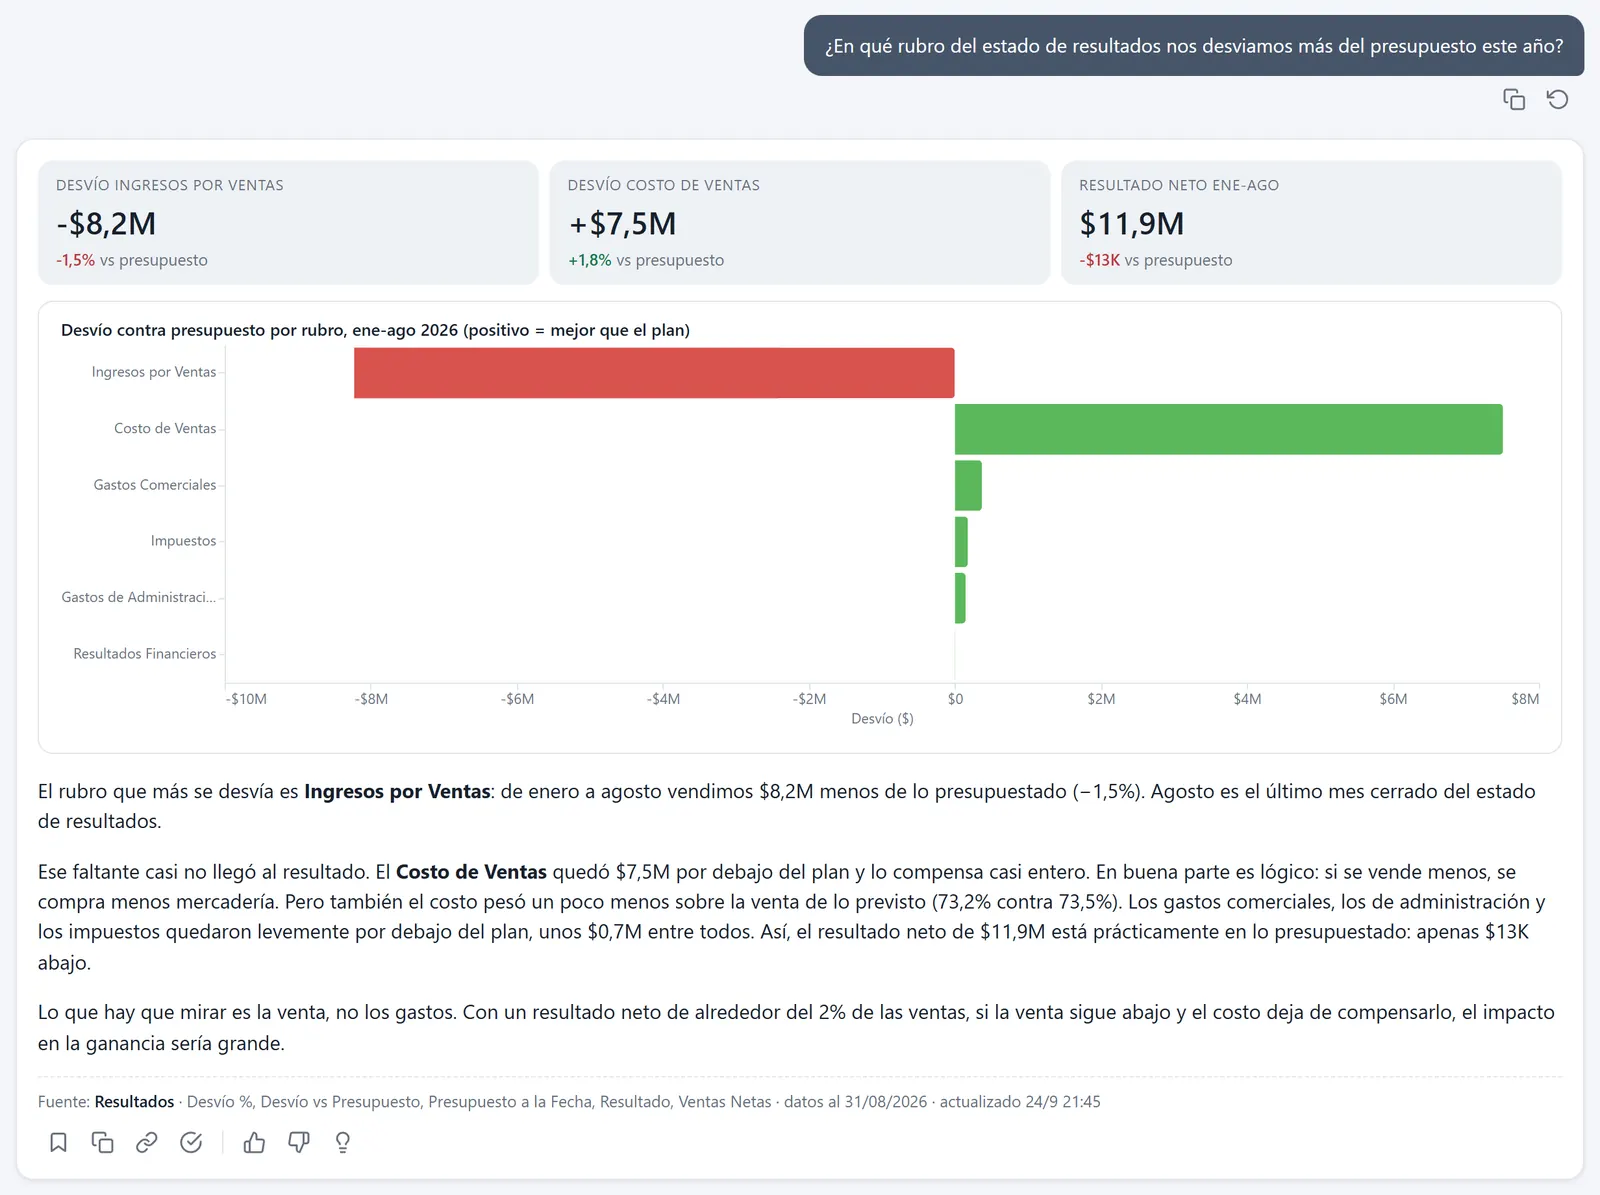
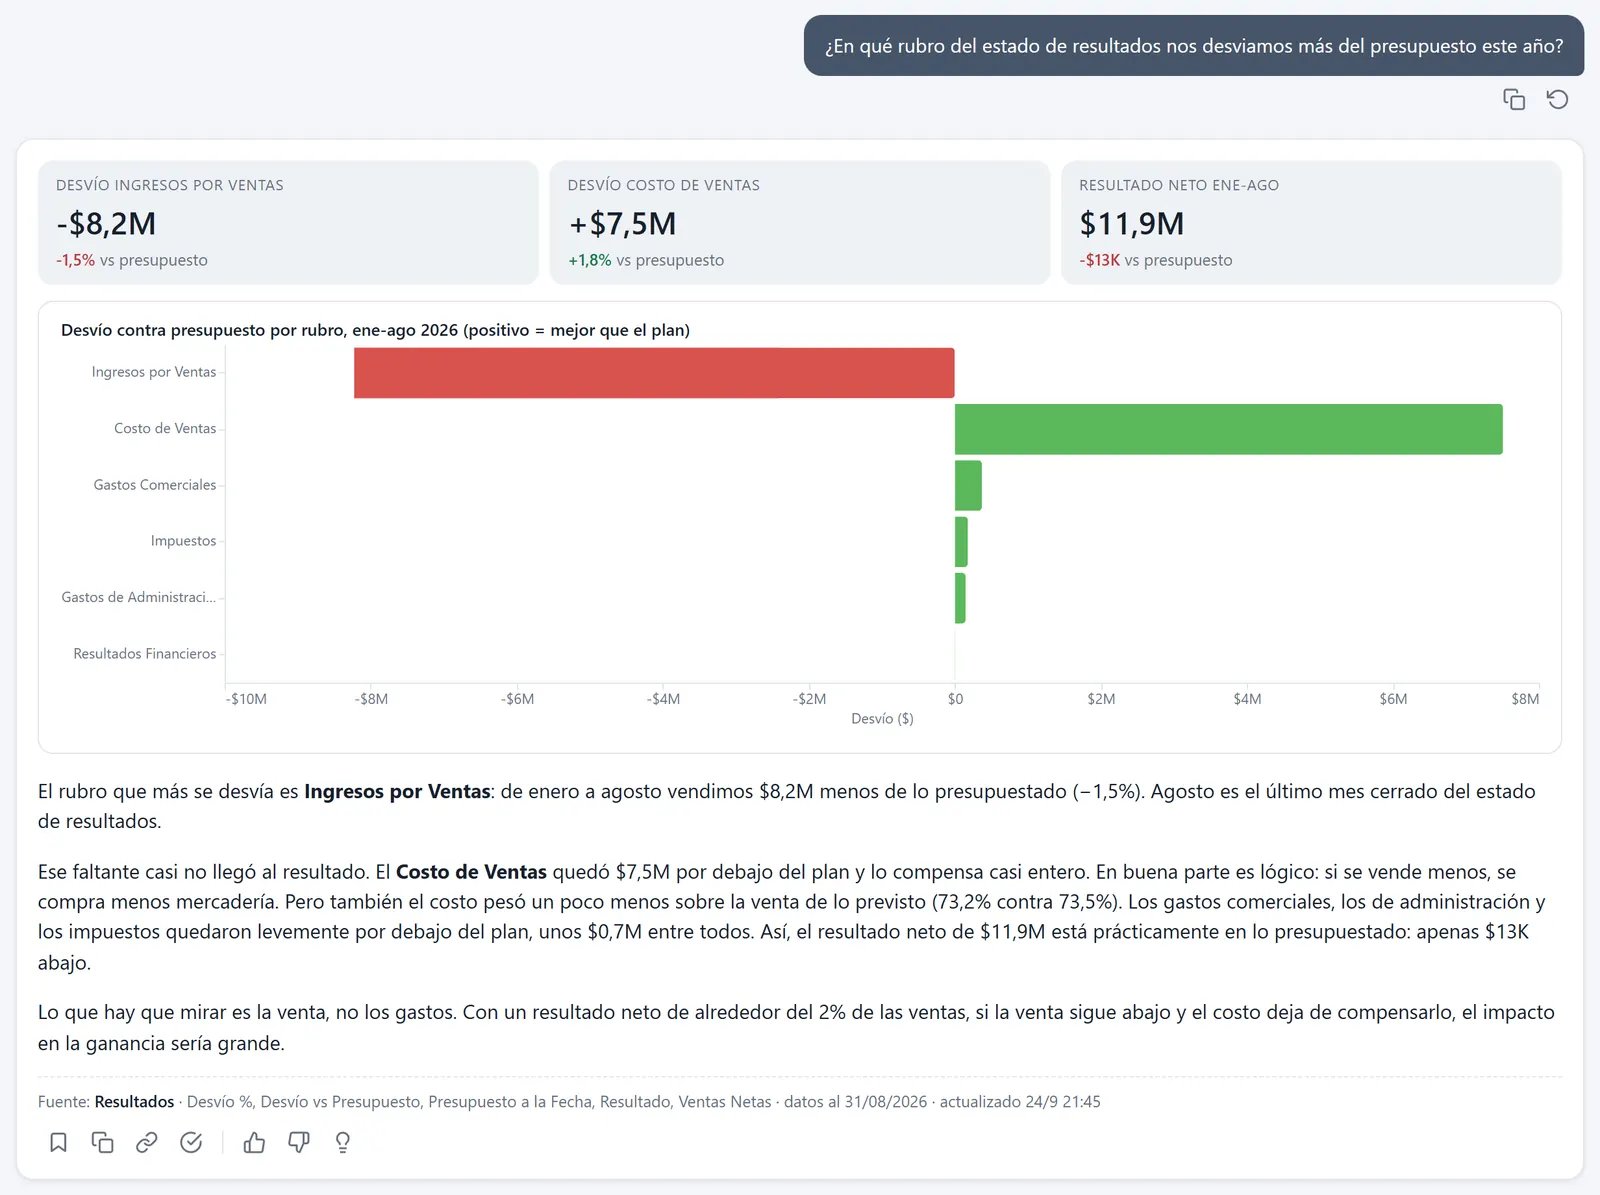
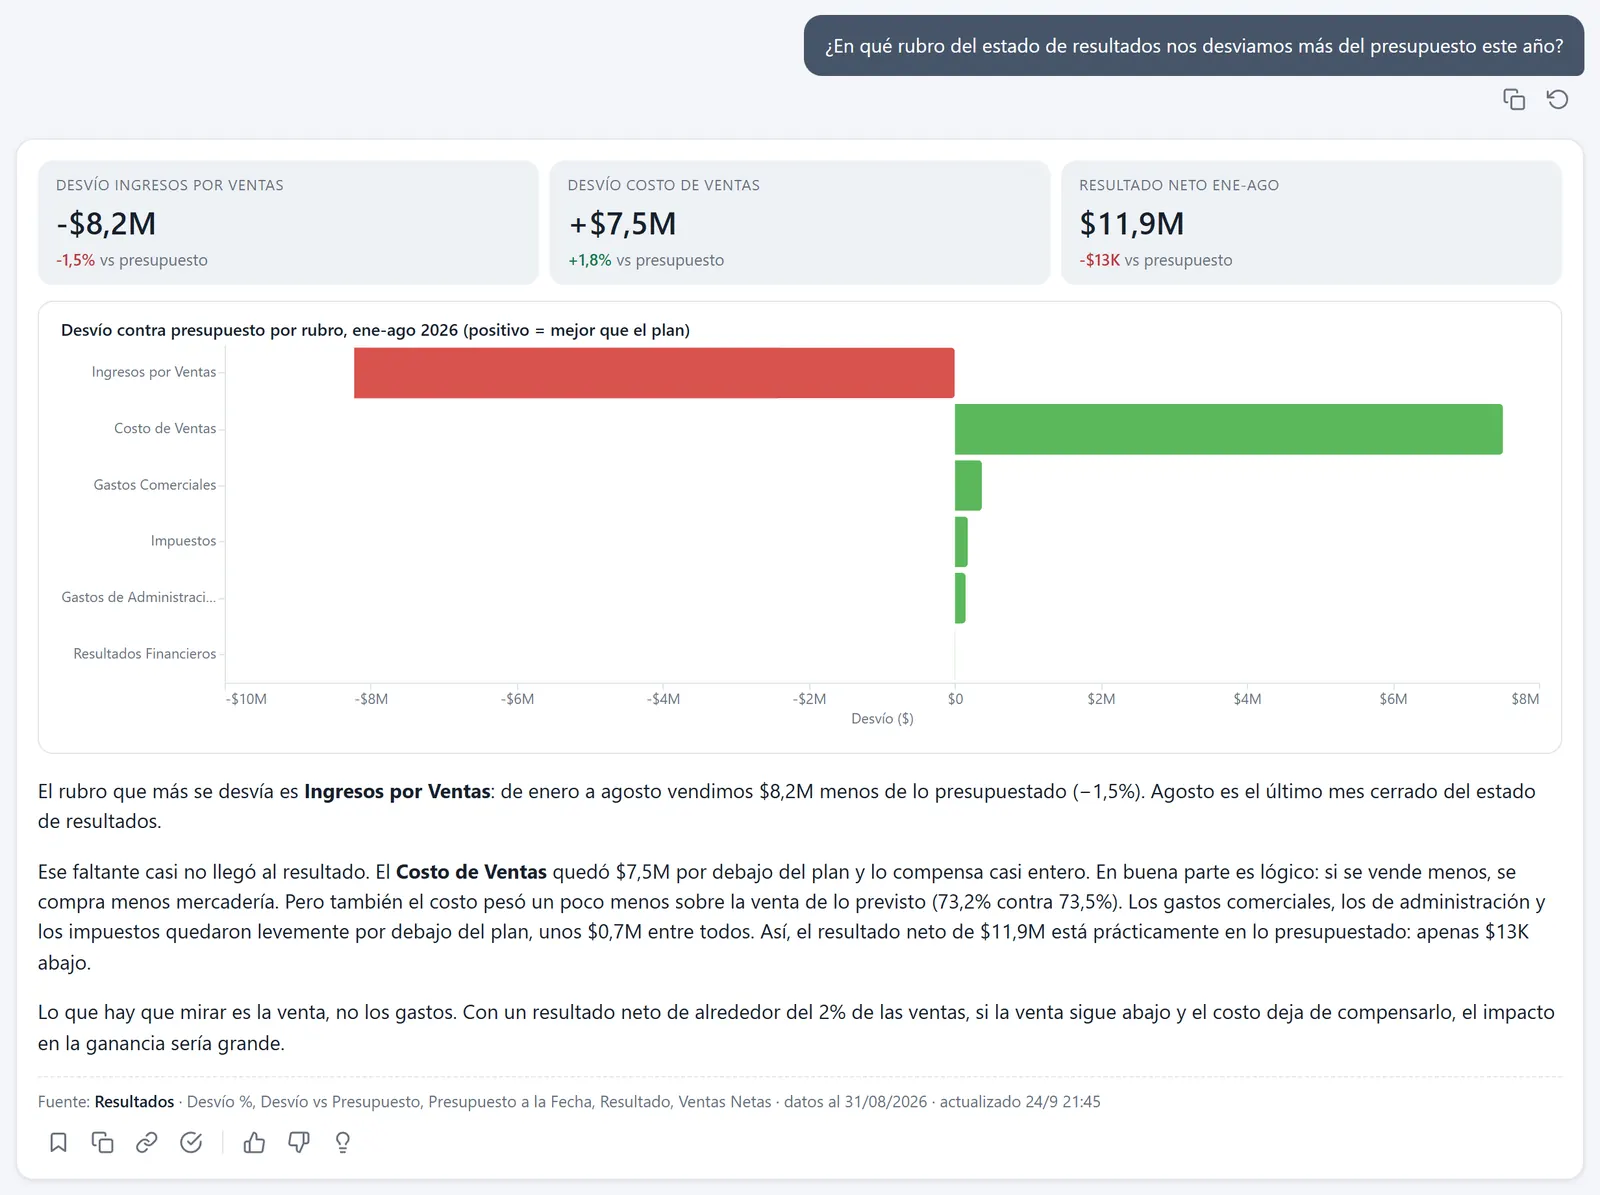
Right: sales revenue, about $8M below. Cost of sales came in under plan and offsets part of it.
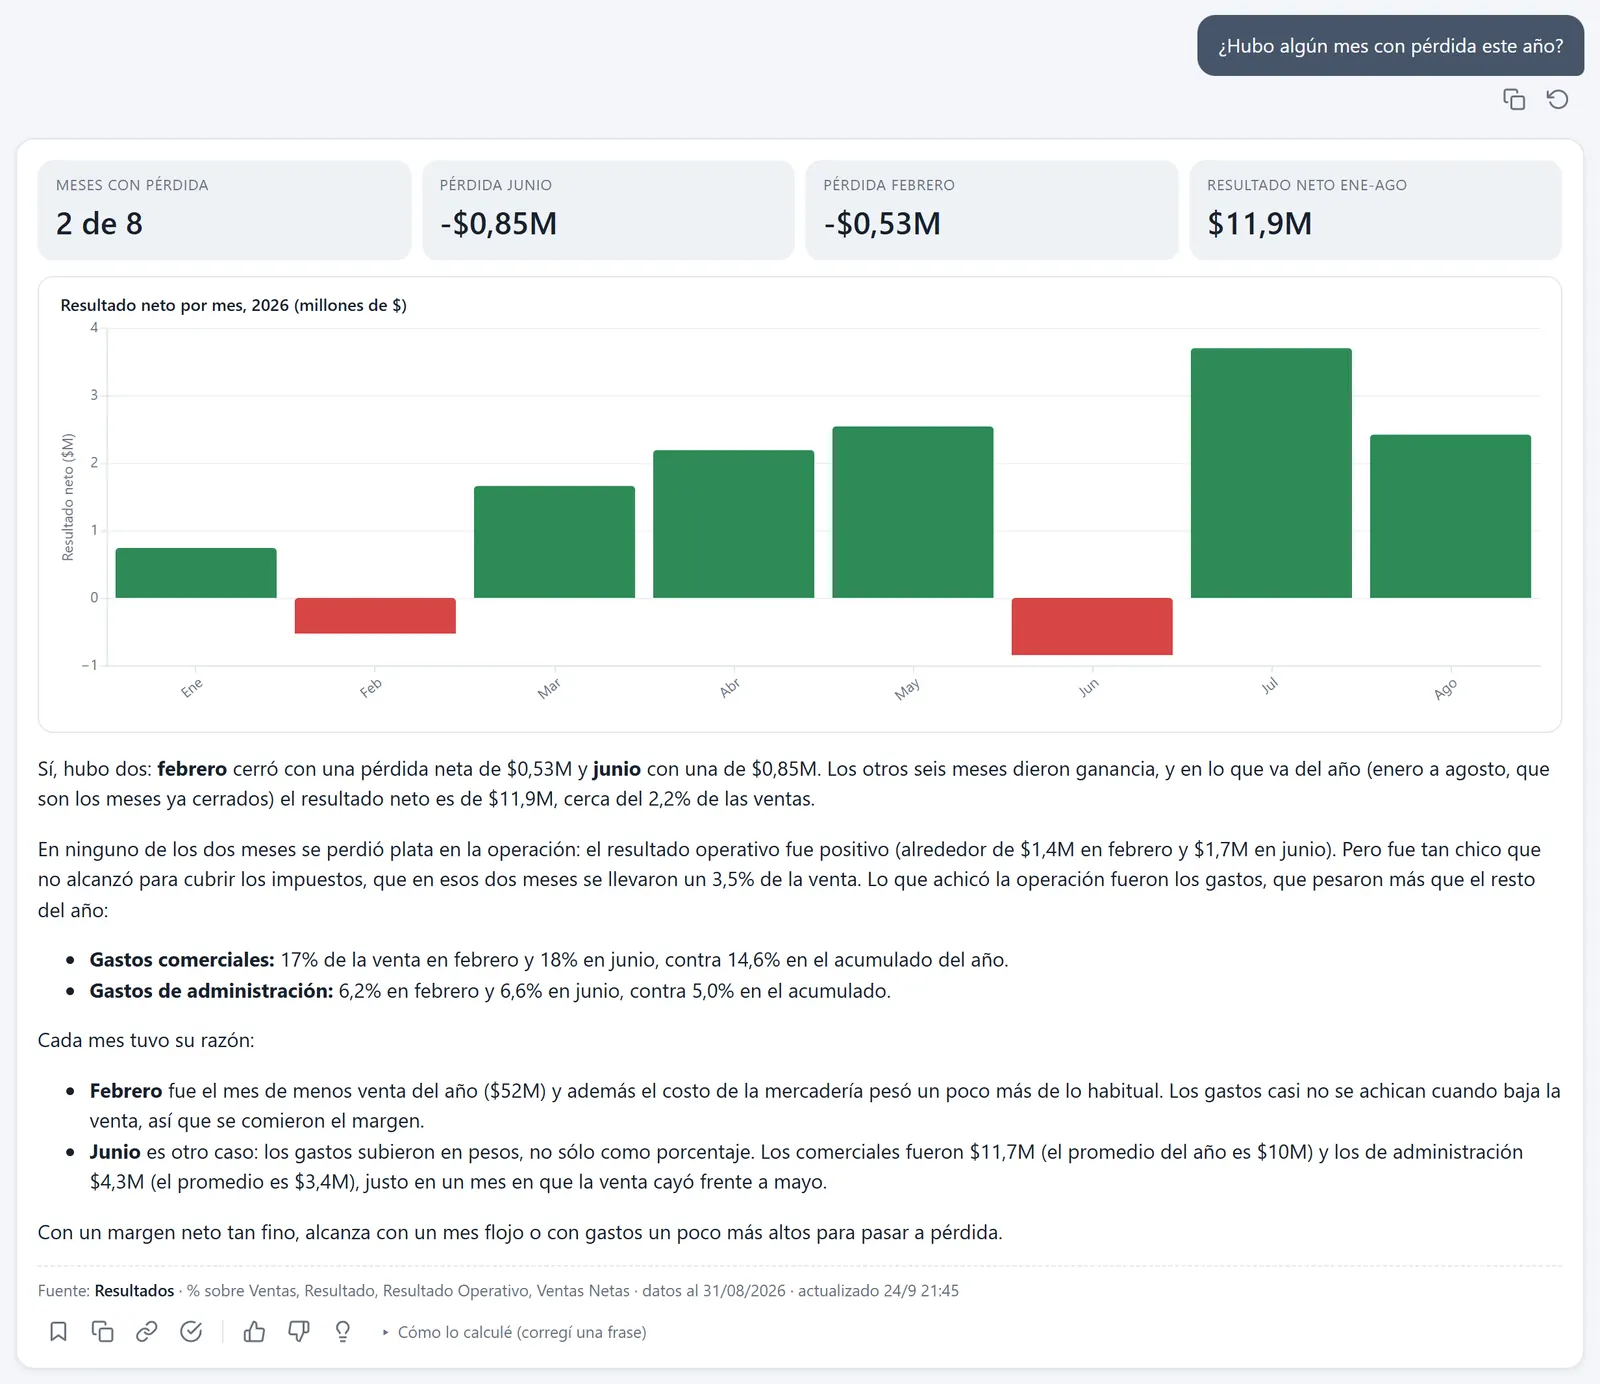
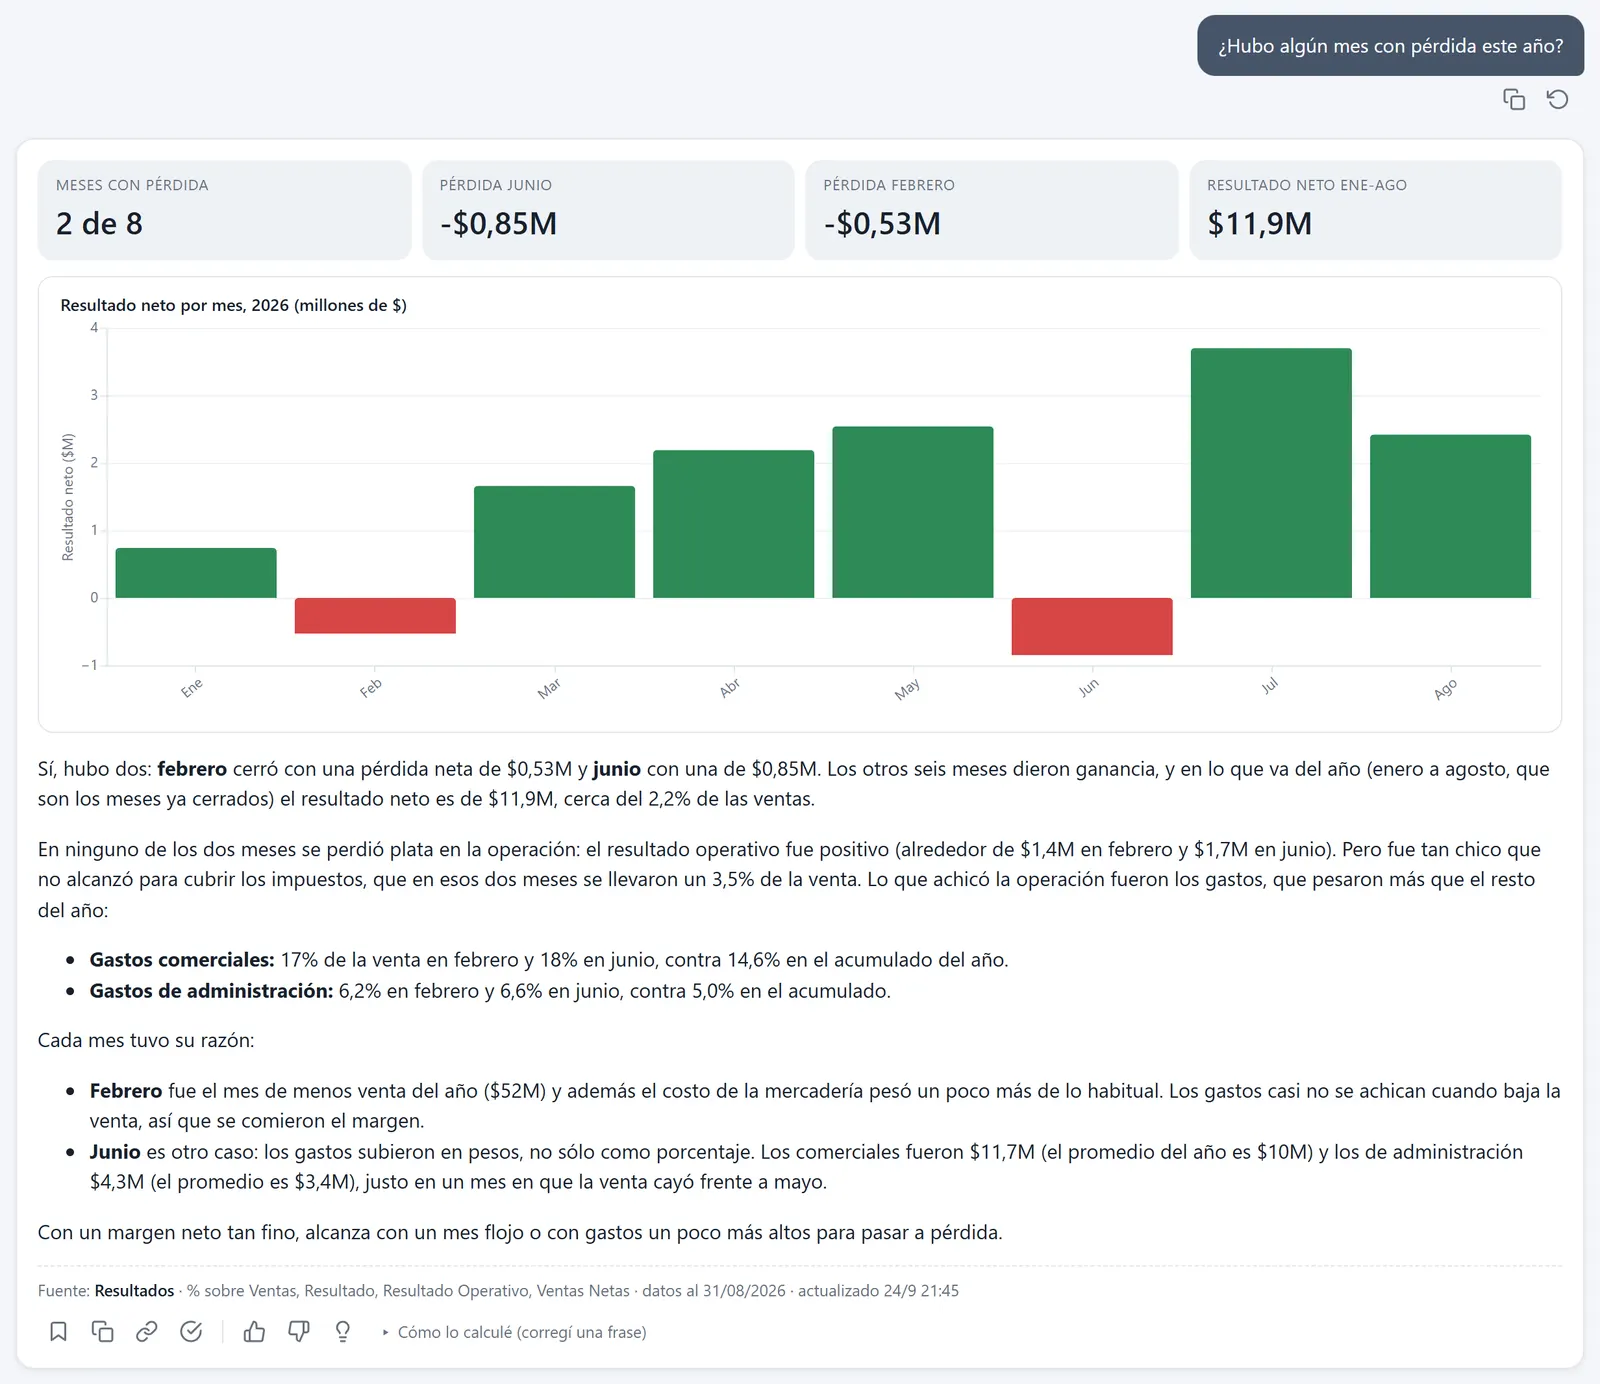
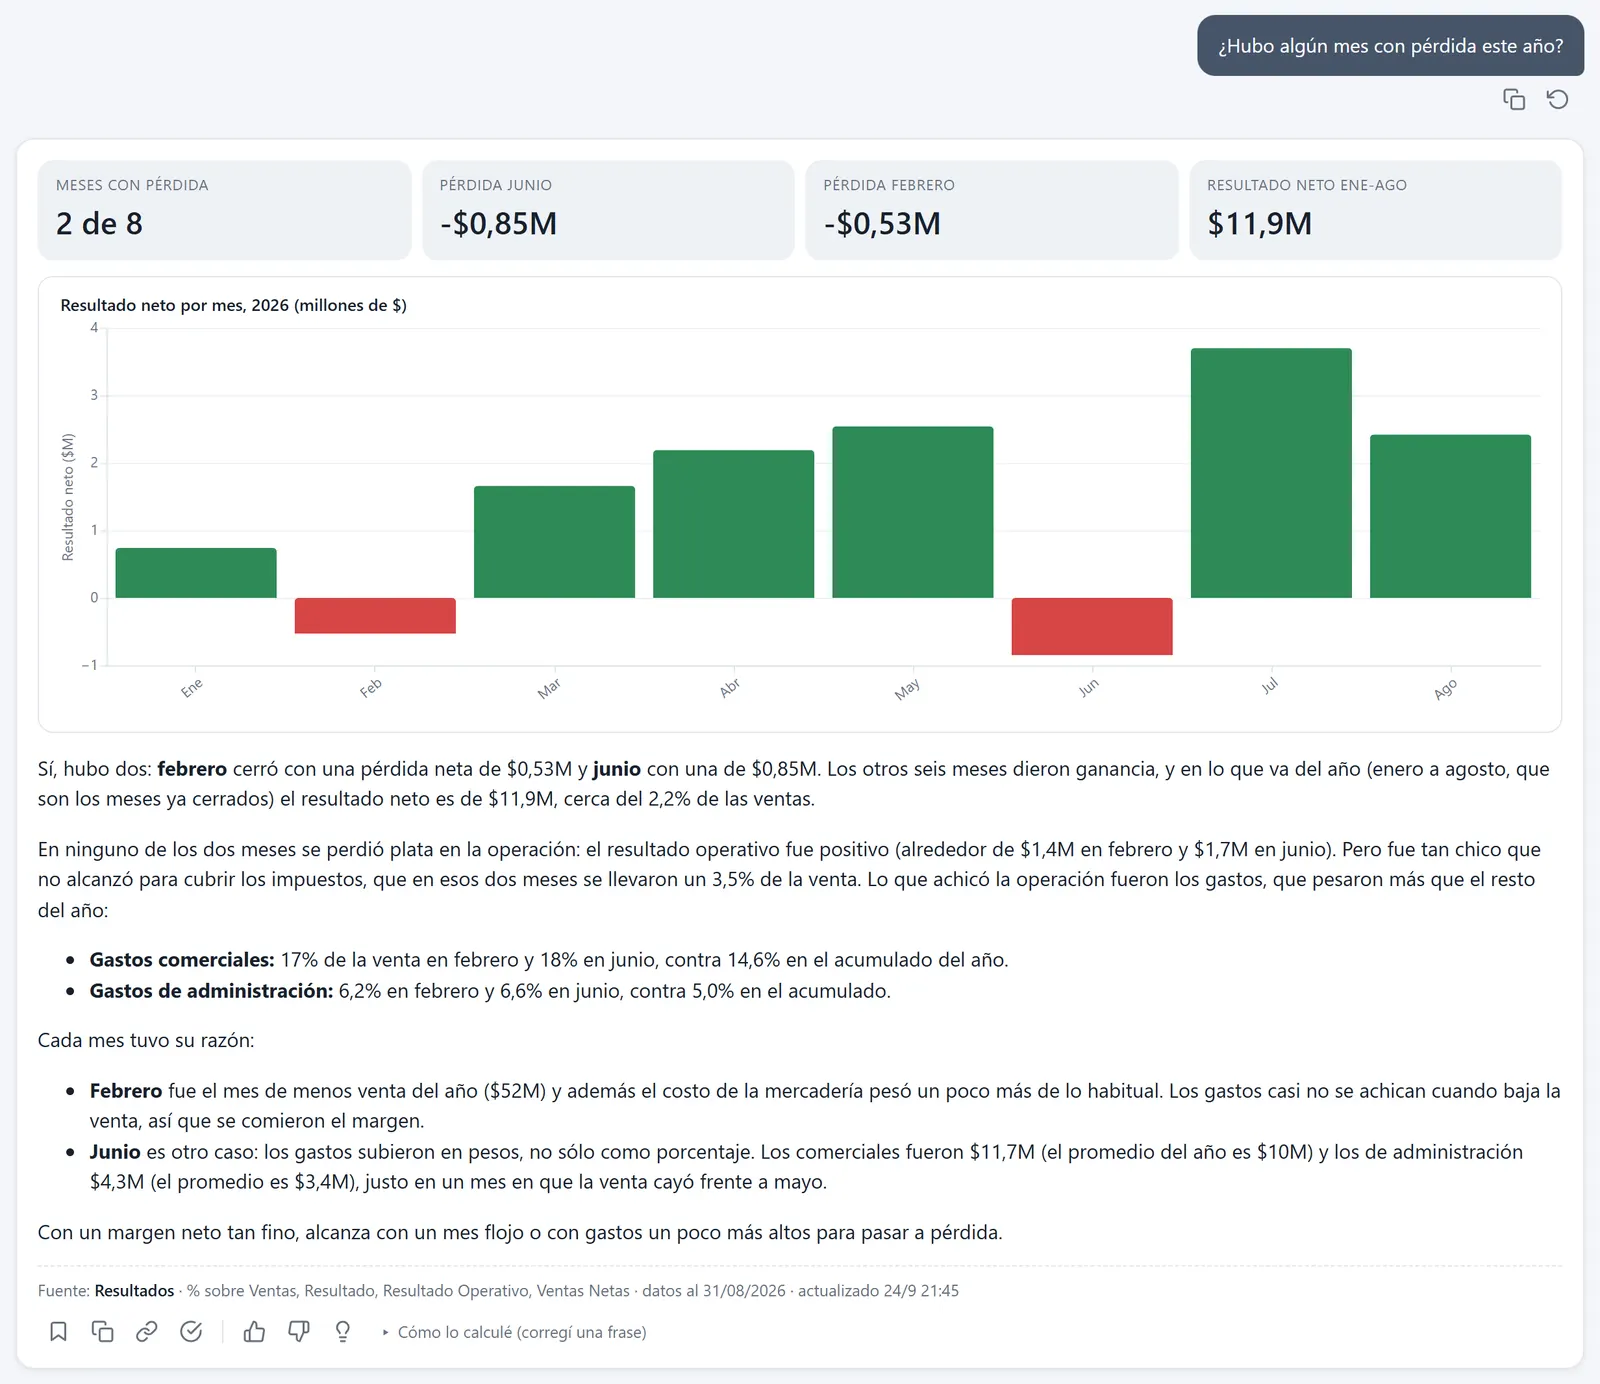
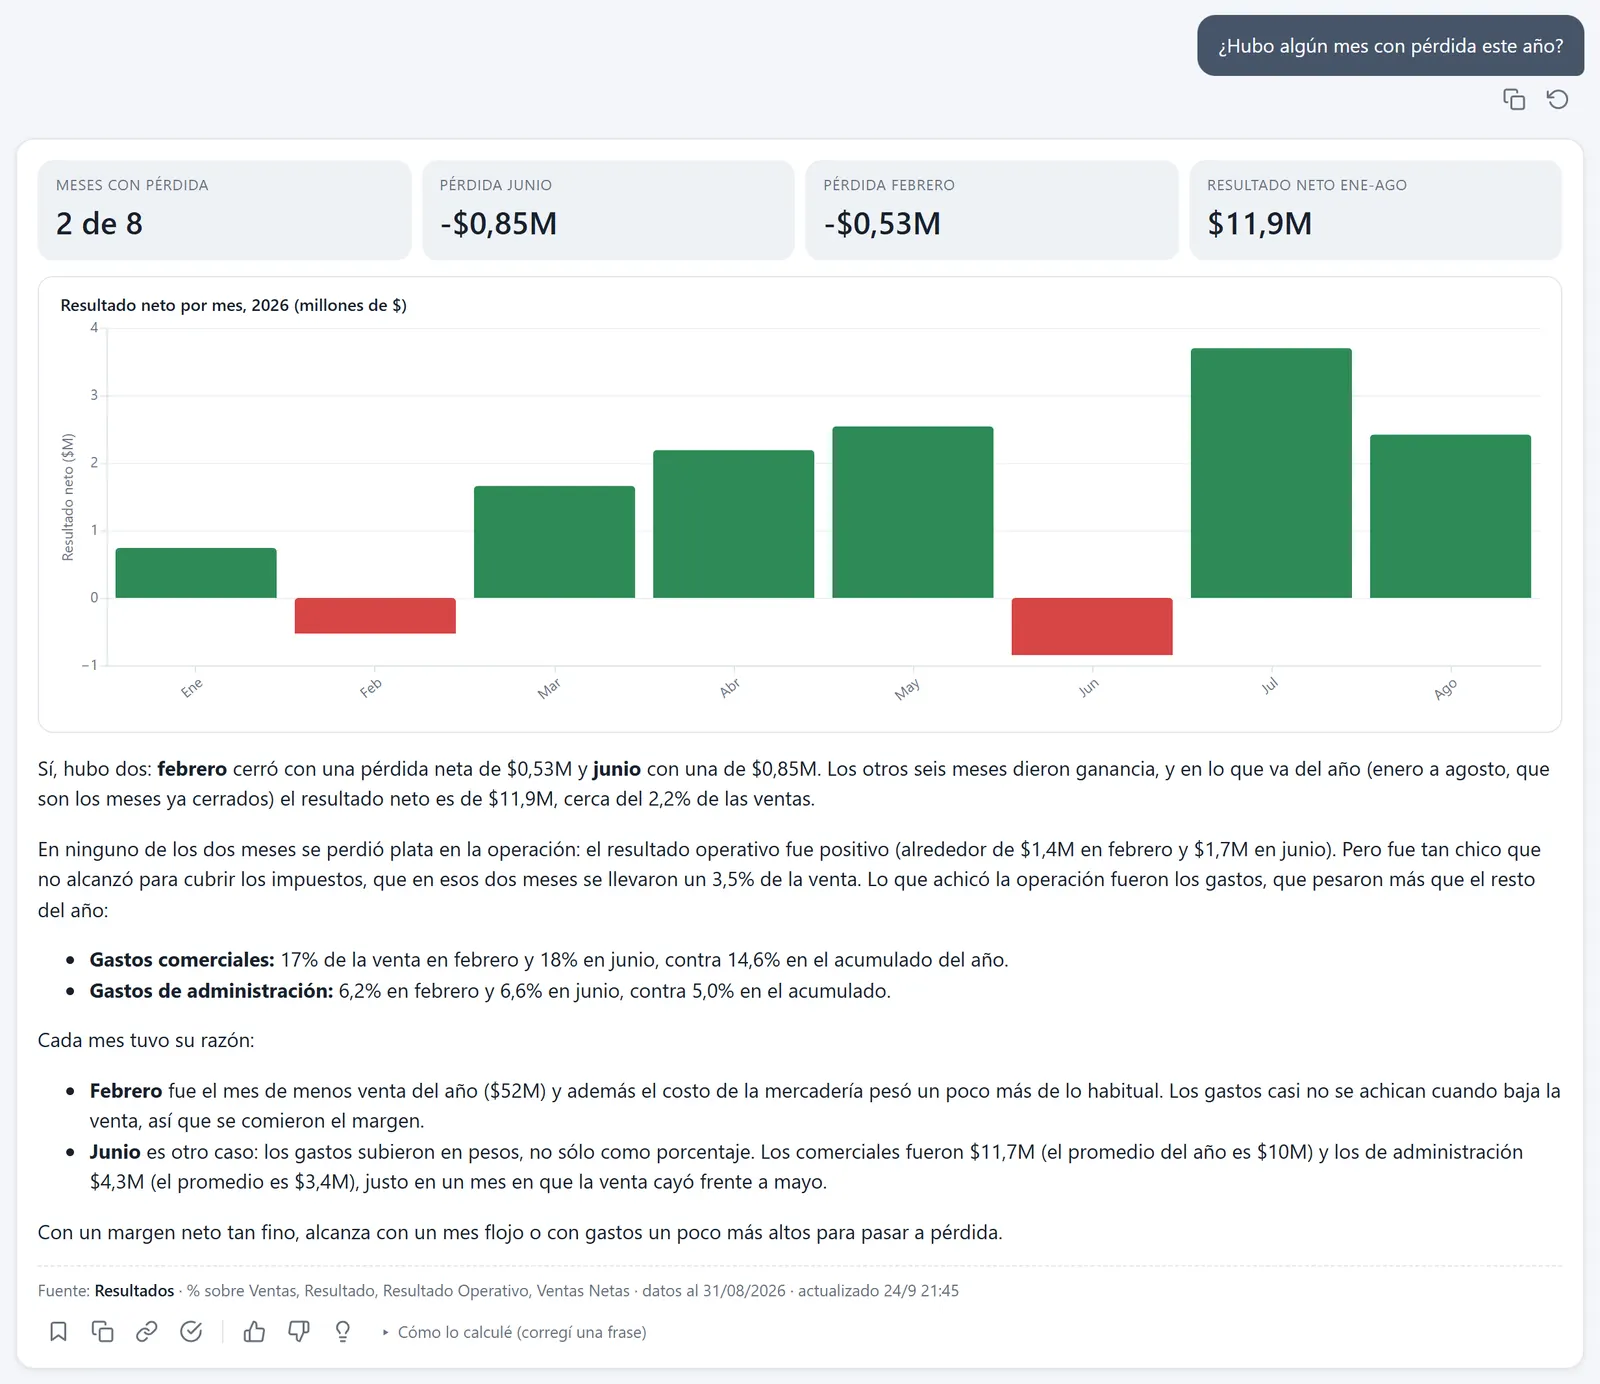
Right: February and June.
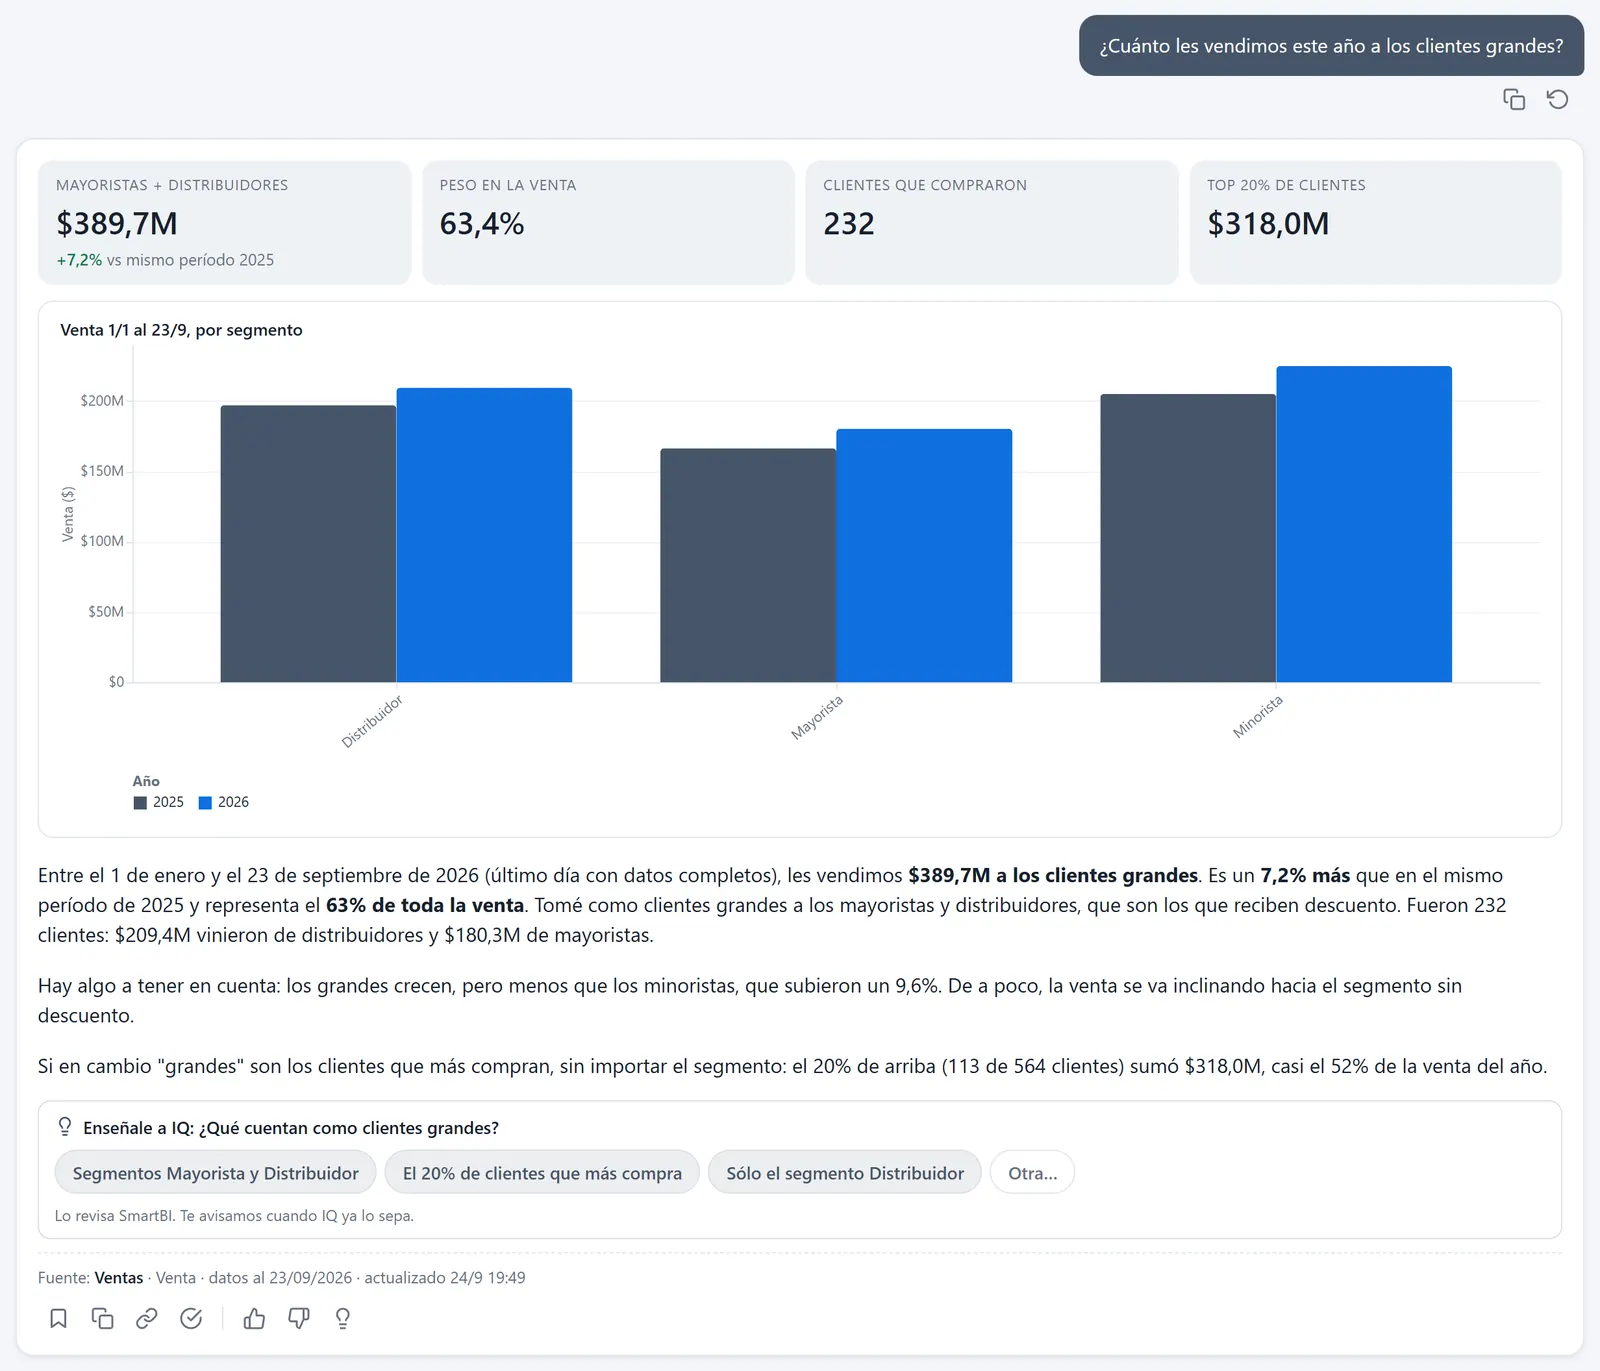
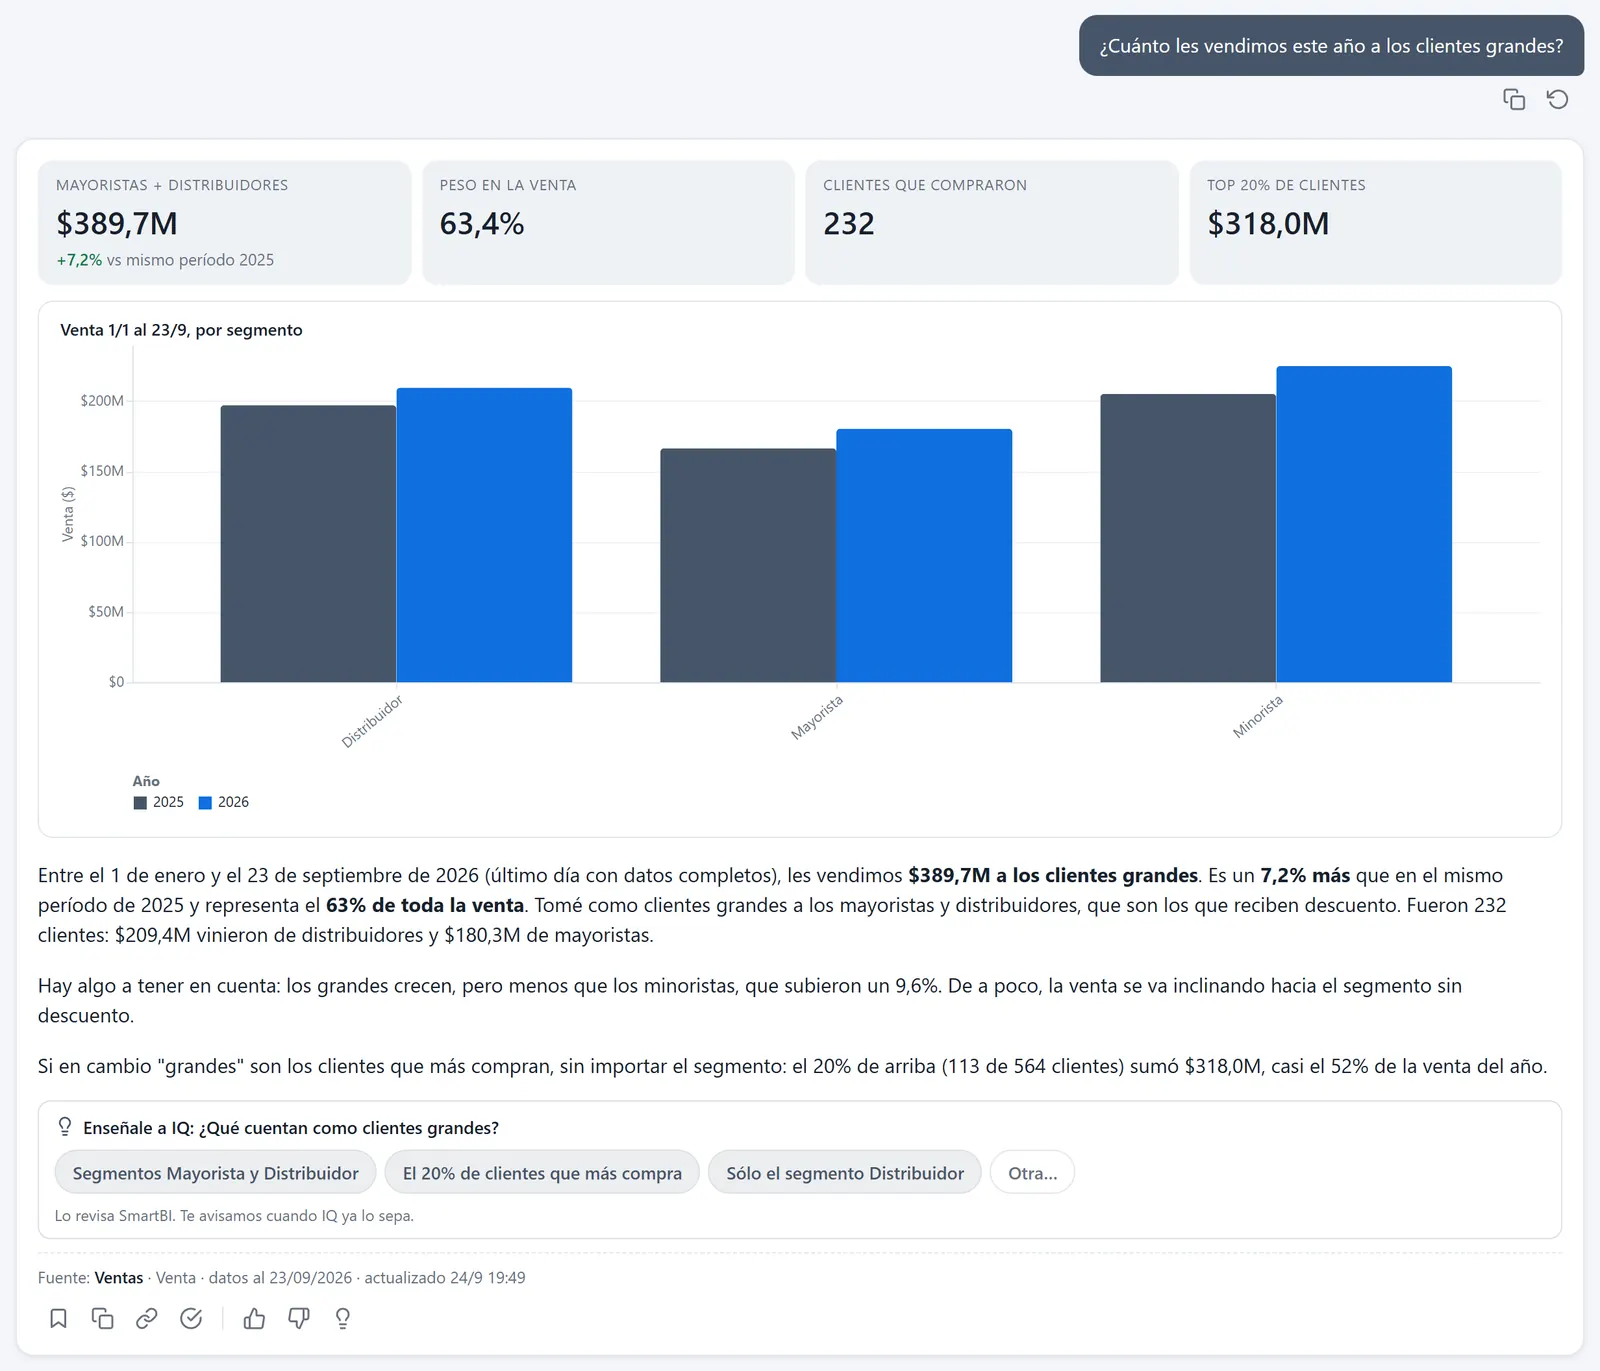
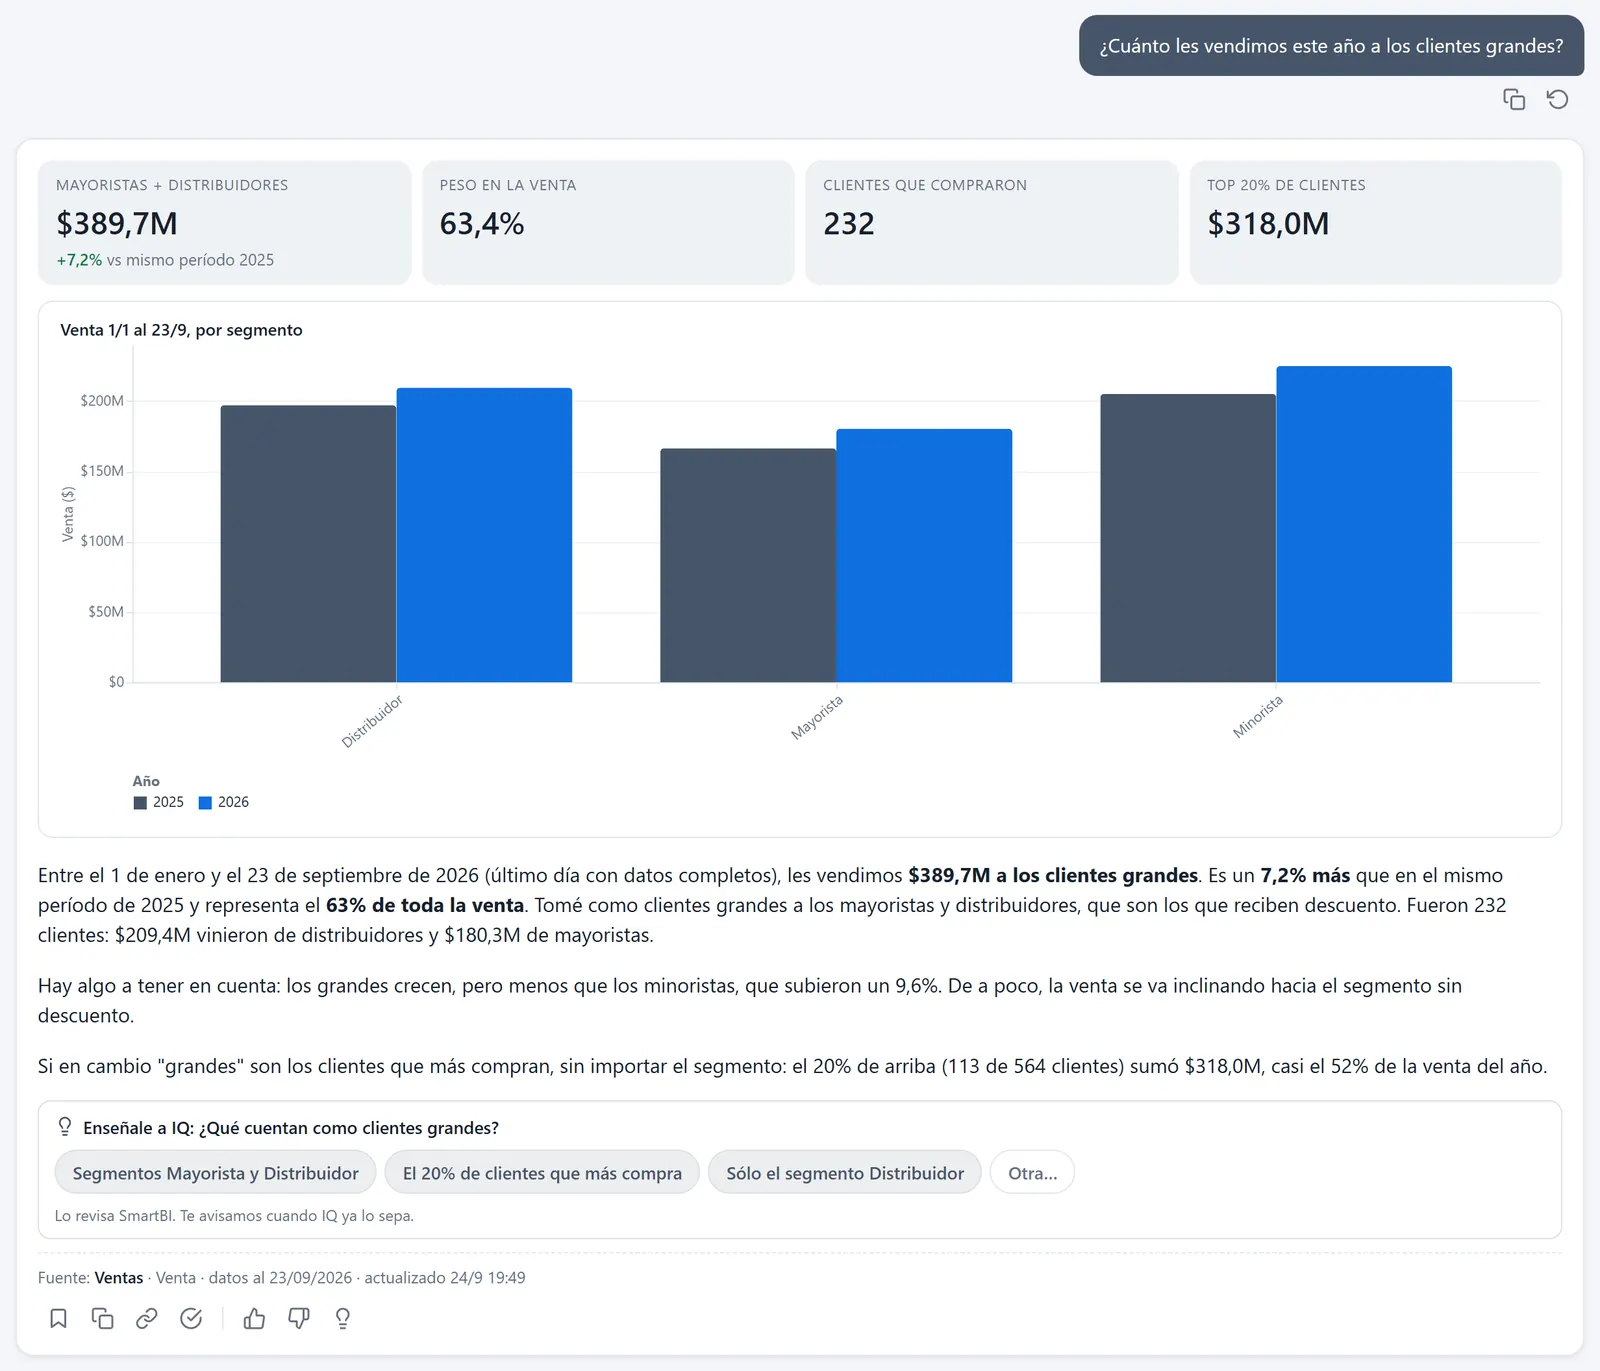
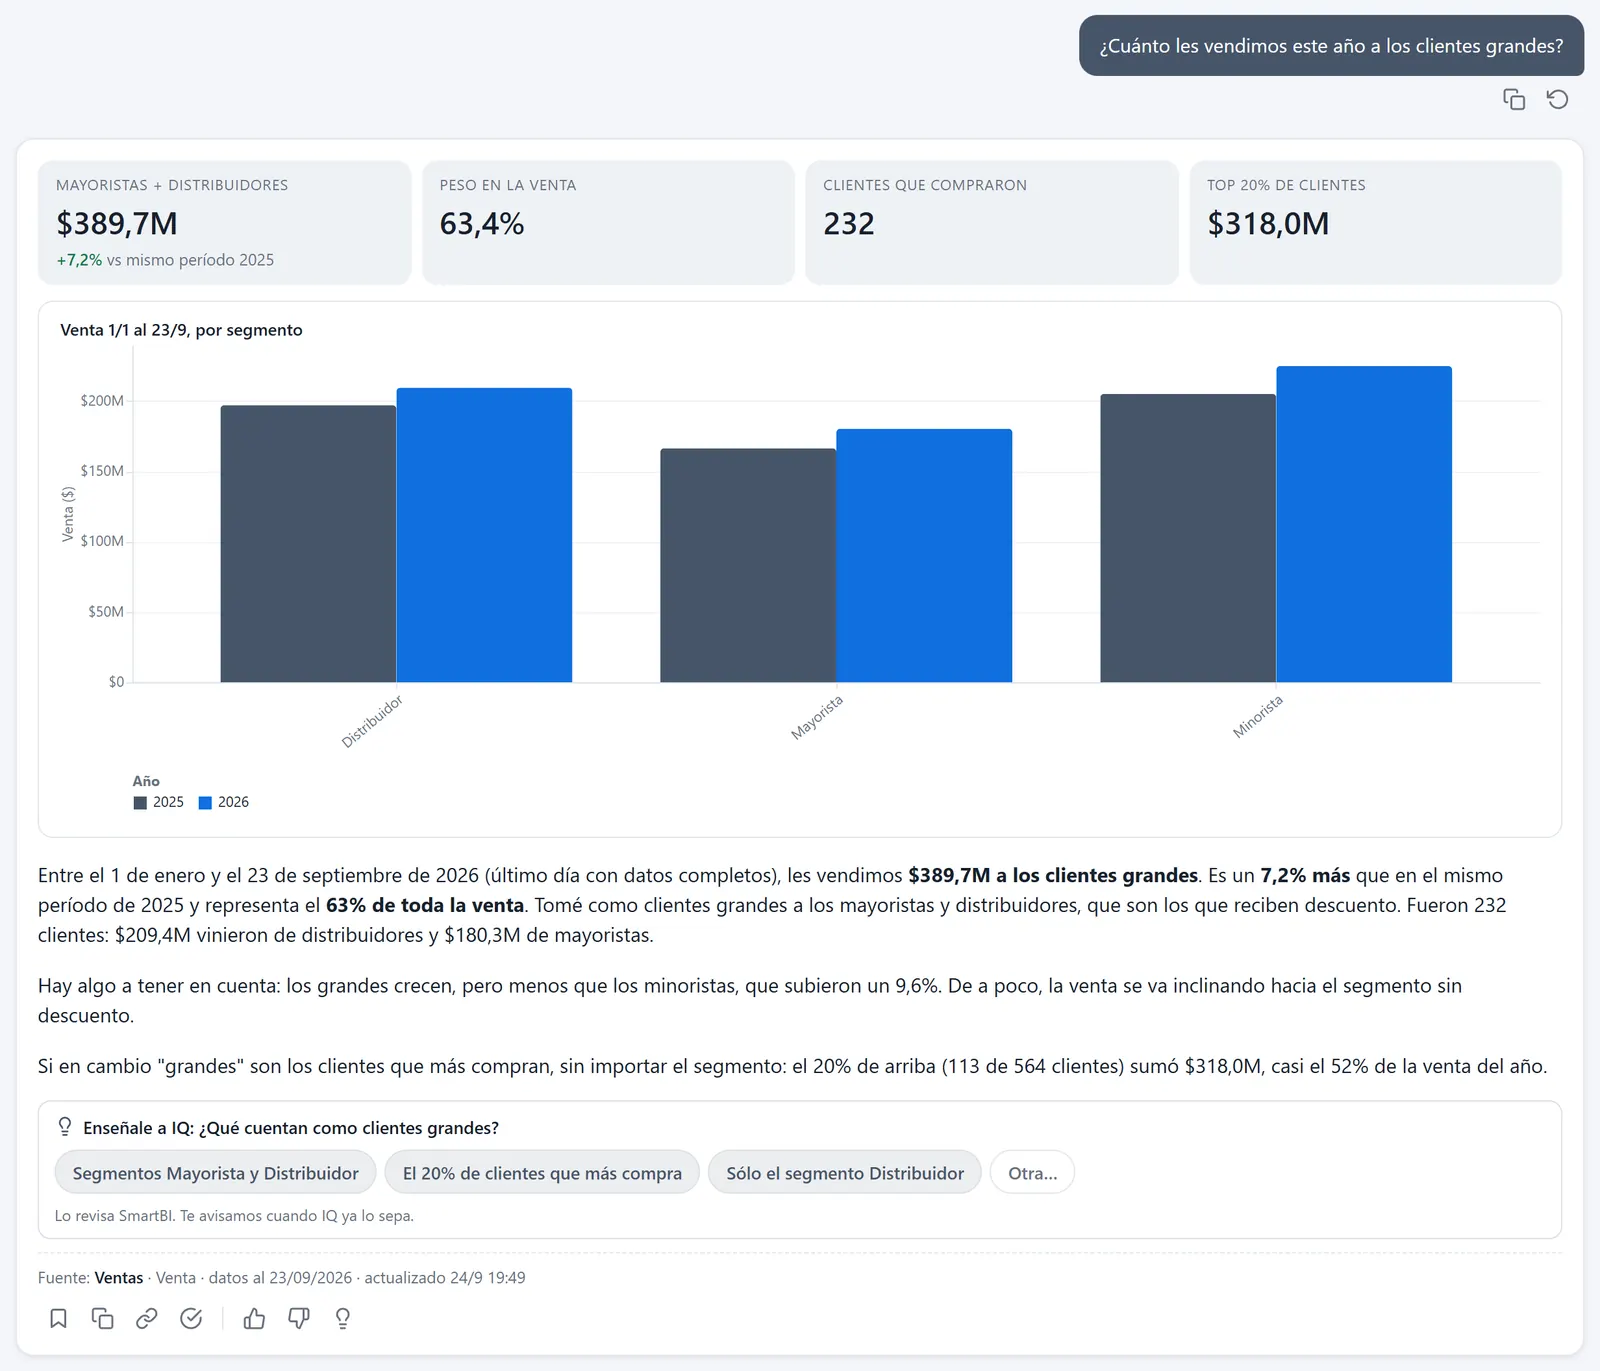
Right: "large customers" is not defined. It has to say what it counted: wholesalers and distributors come to $389.7M.
"I took large customers to mean wholesalers and distributors": $389.7M. And it offers the other reading, the top 20% by purchases.
"The model does not define a large customer": it gives both possible figures and asks which one they use.
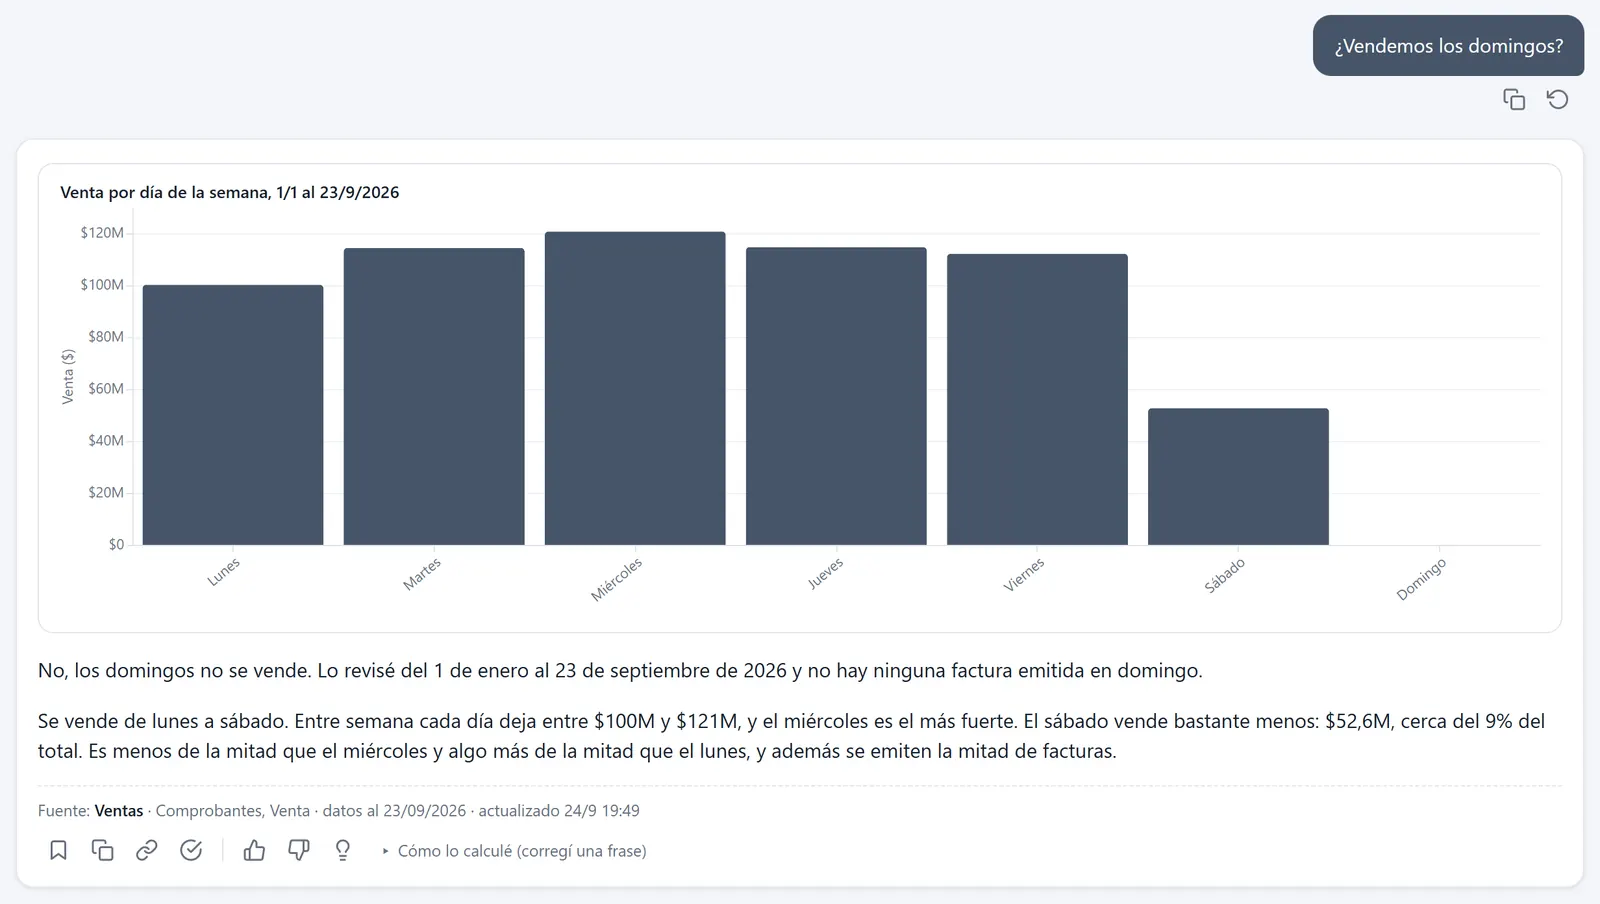
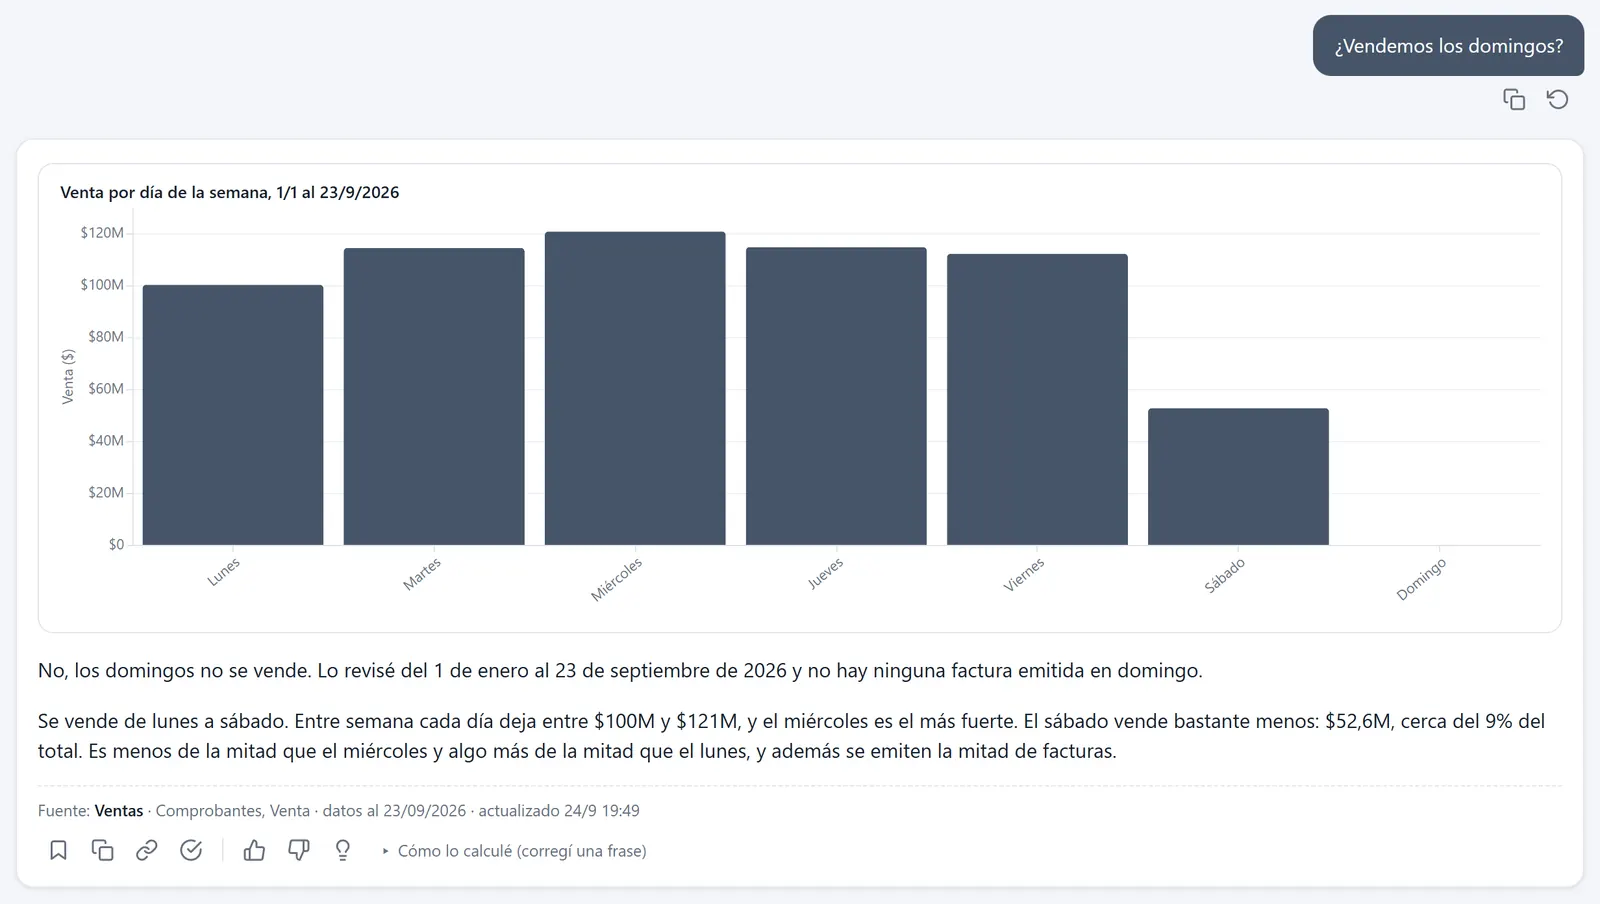
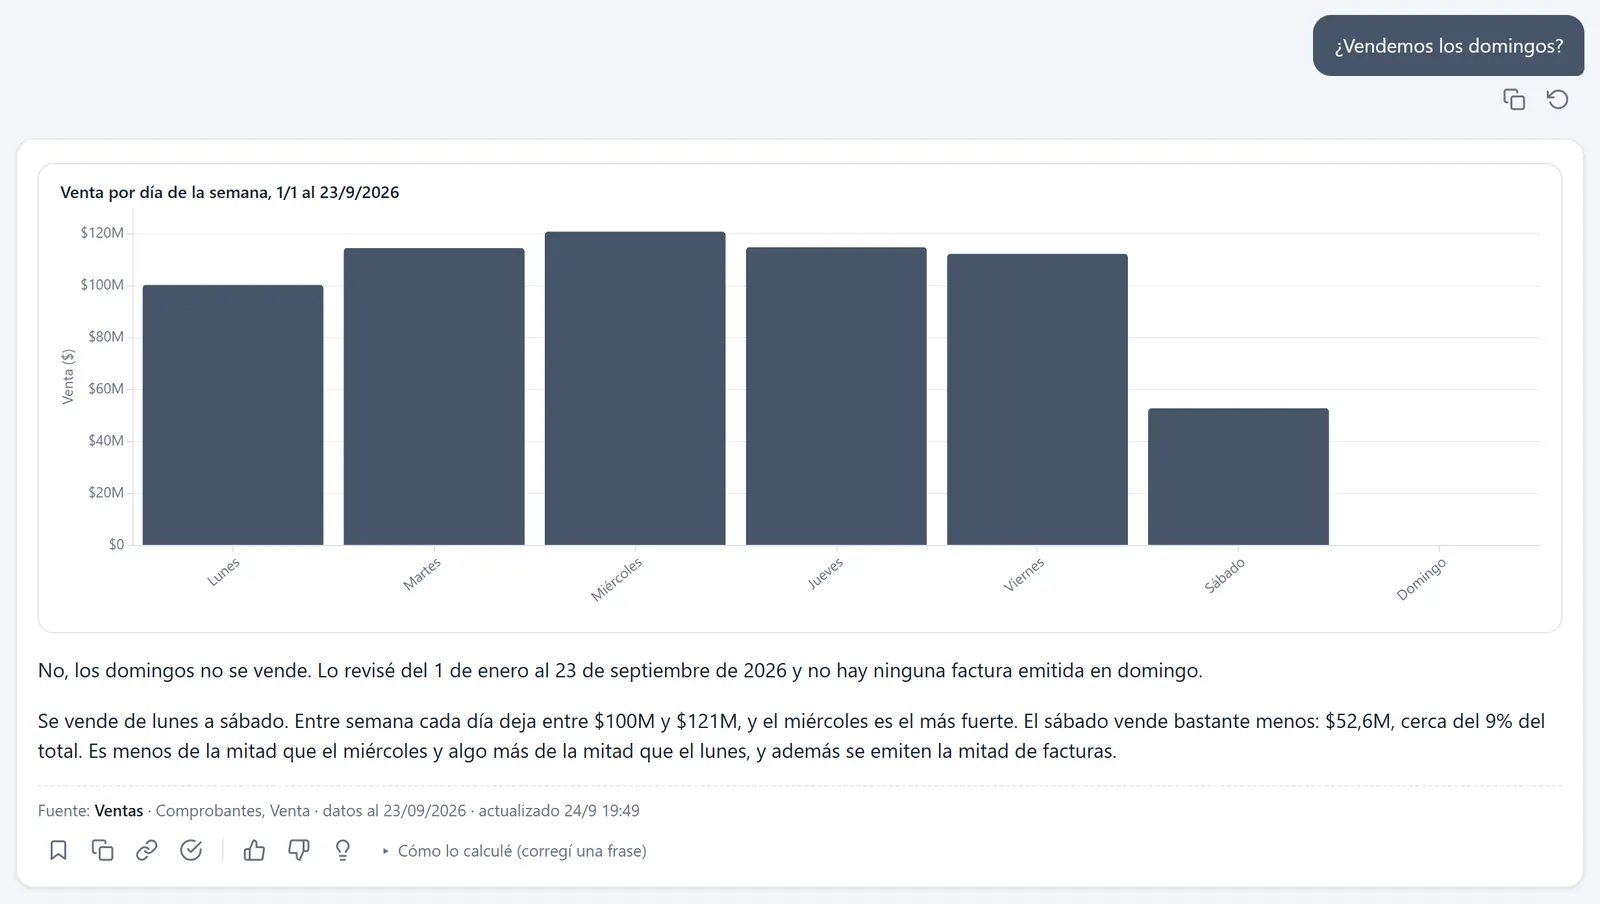
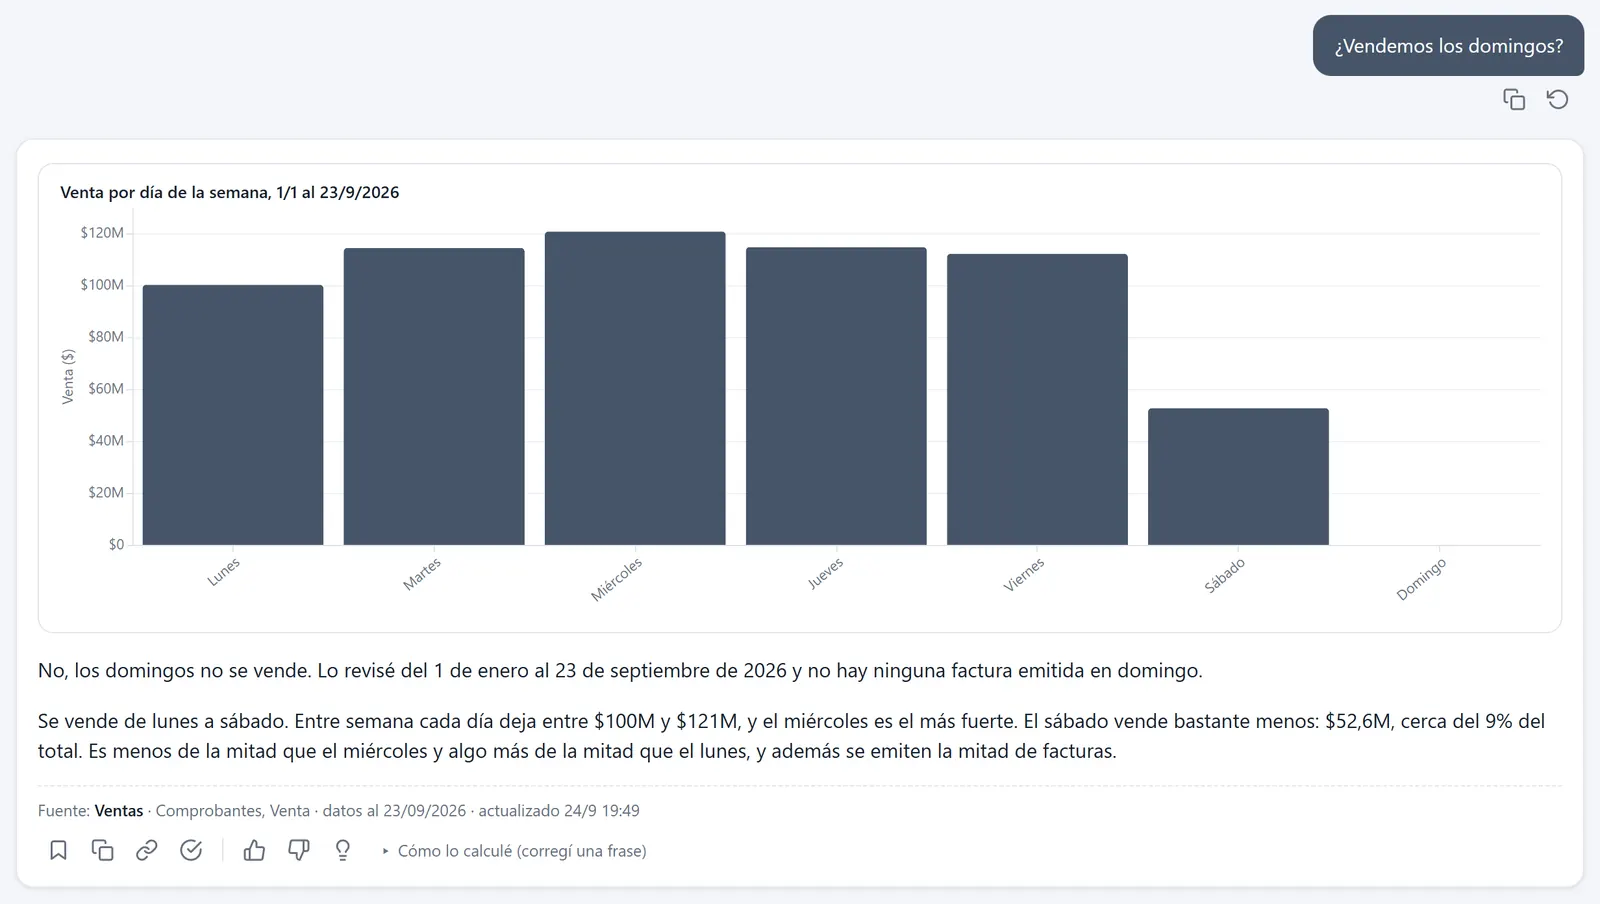
Right: there are no Sunday sales, and Saturday sells considerably less than a weekday.
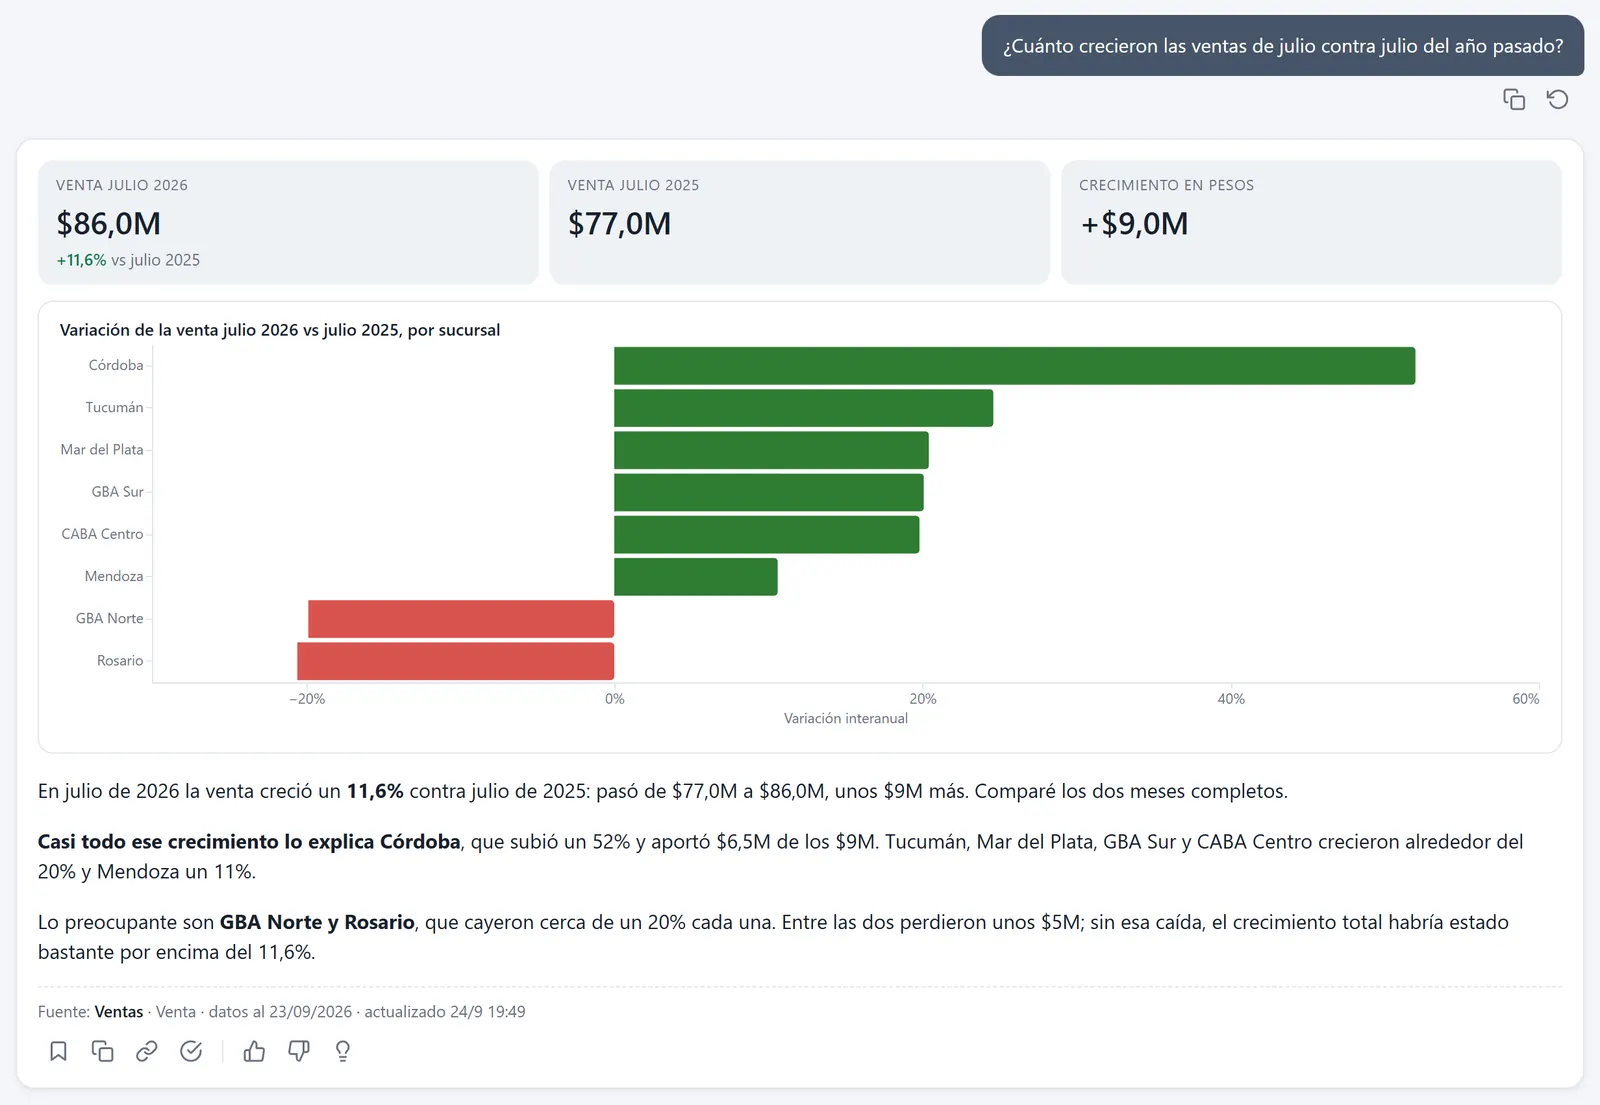
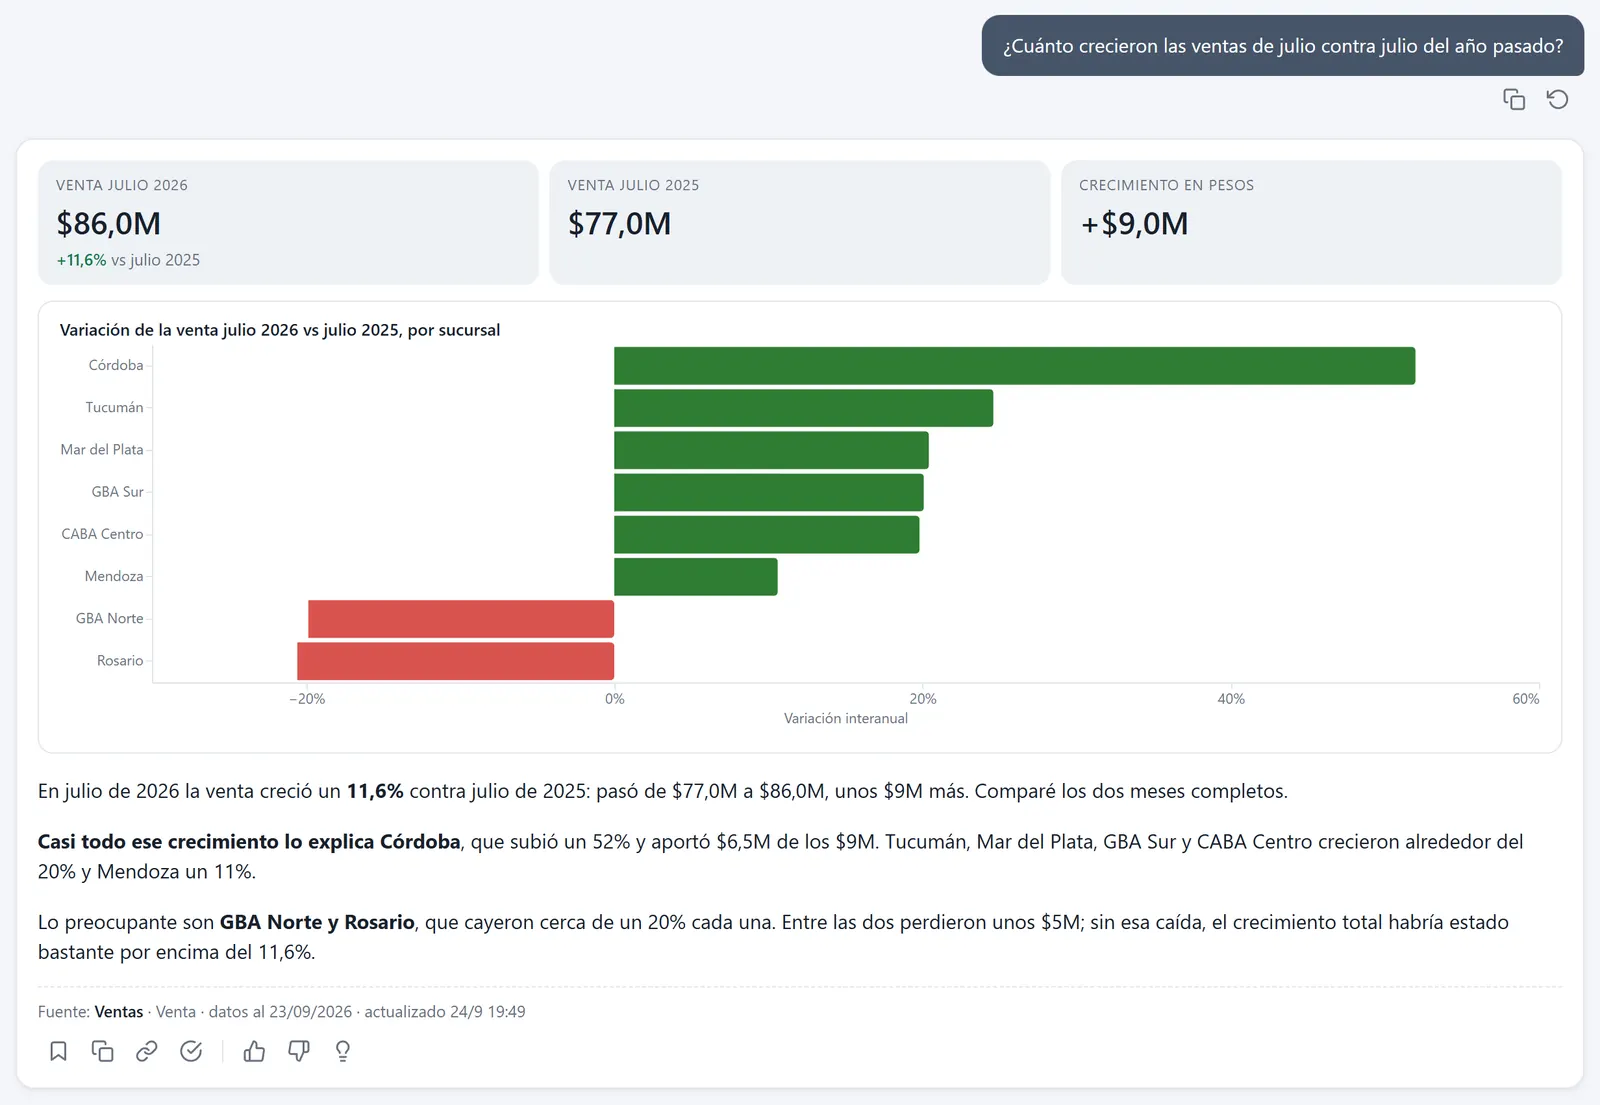
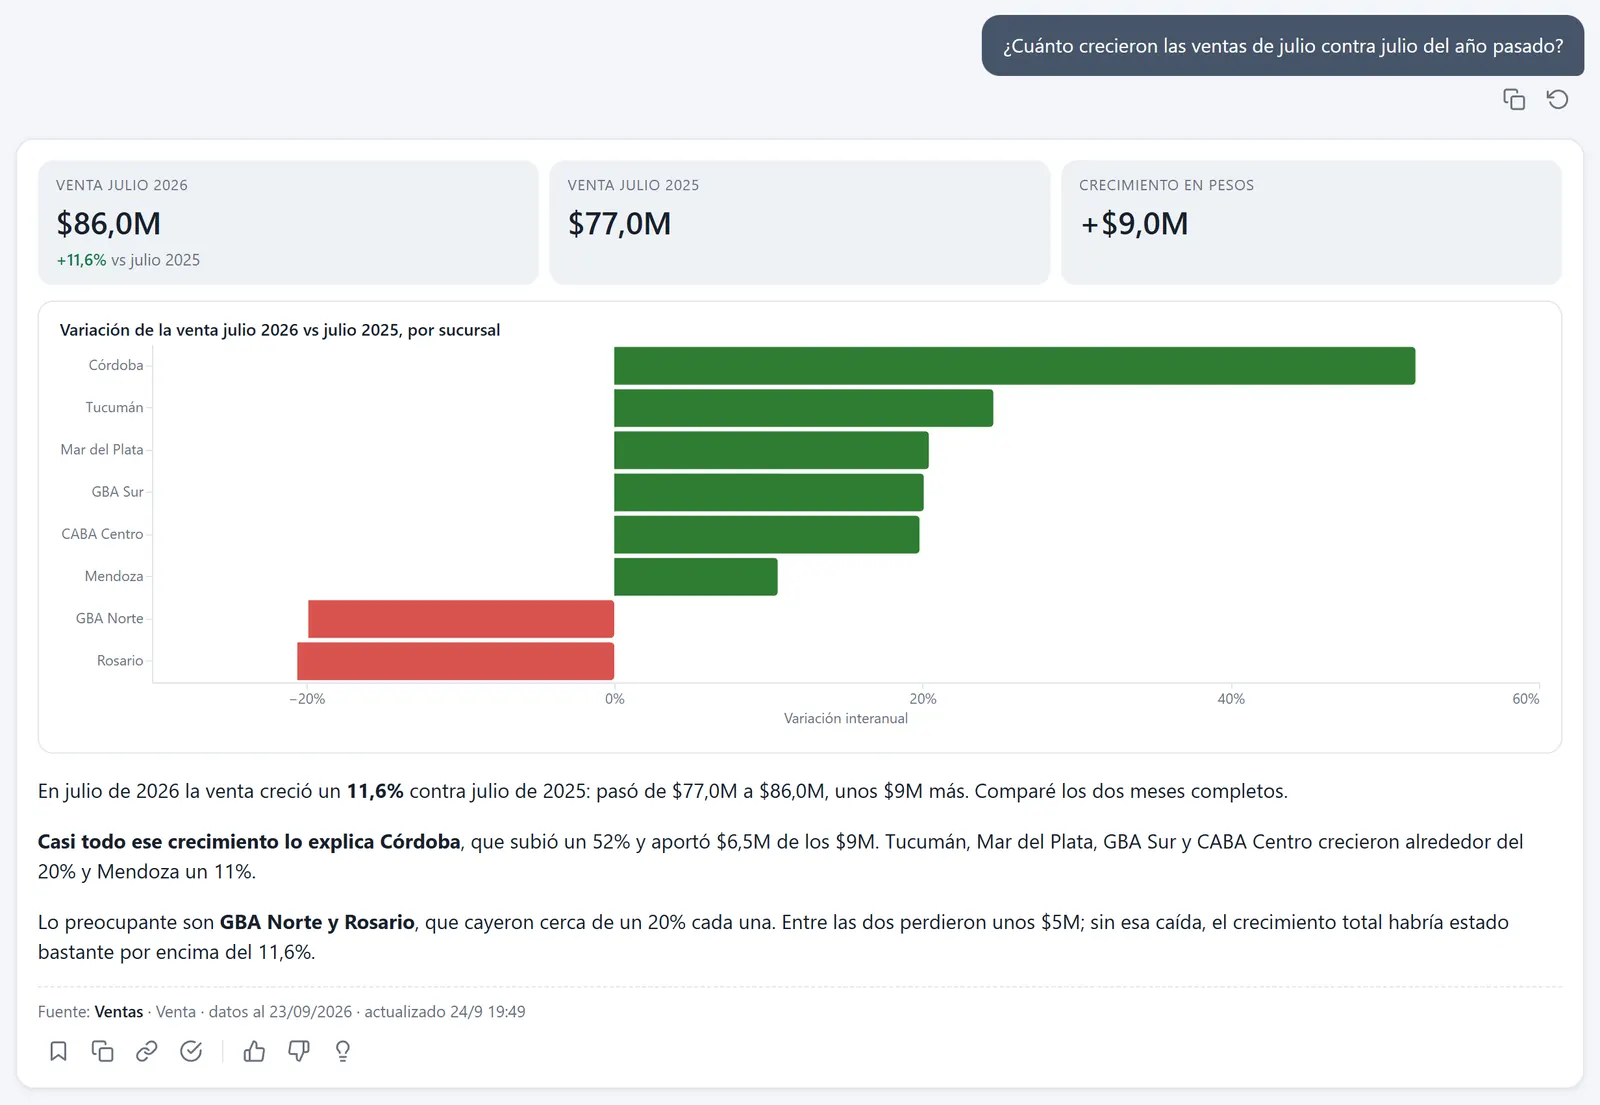
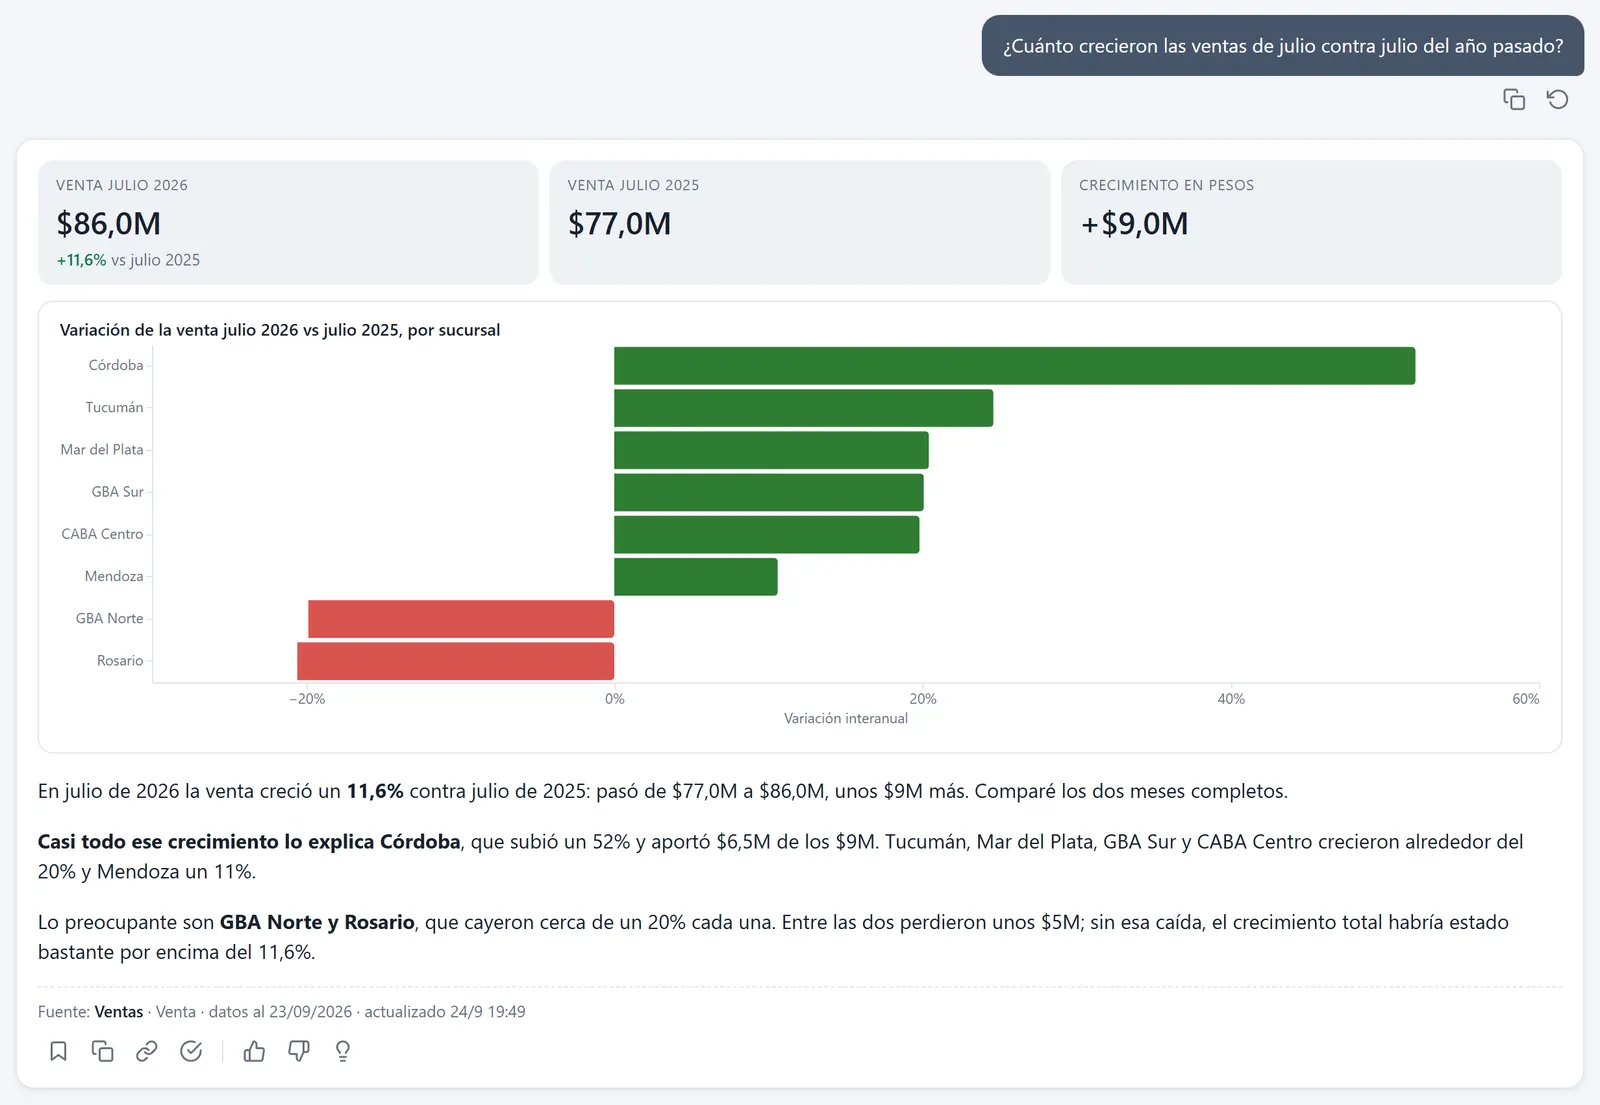
Right: +11.6%: $86.0M against $77.0M.
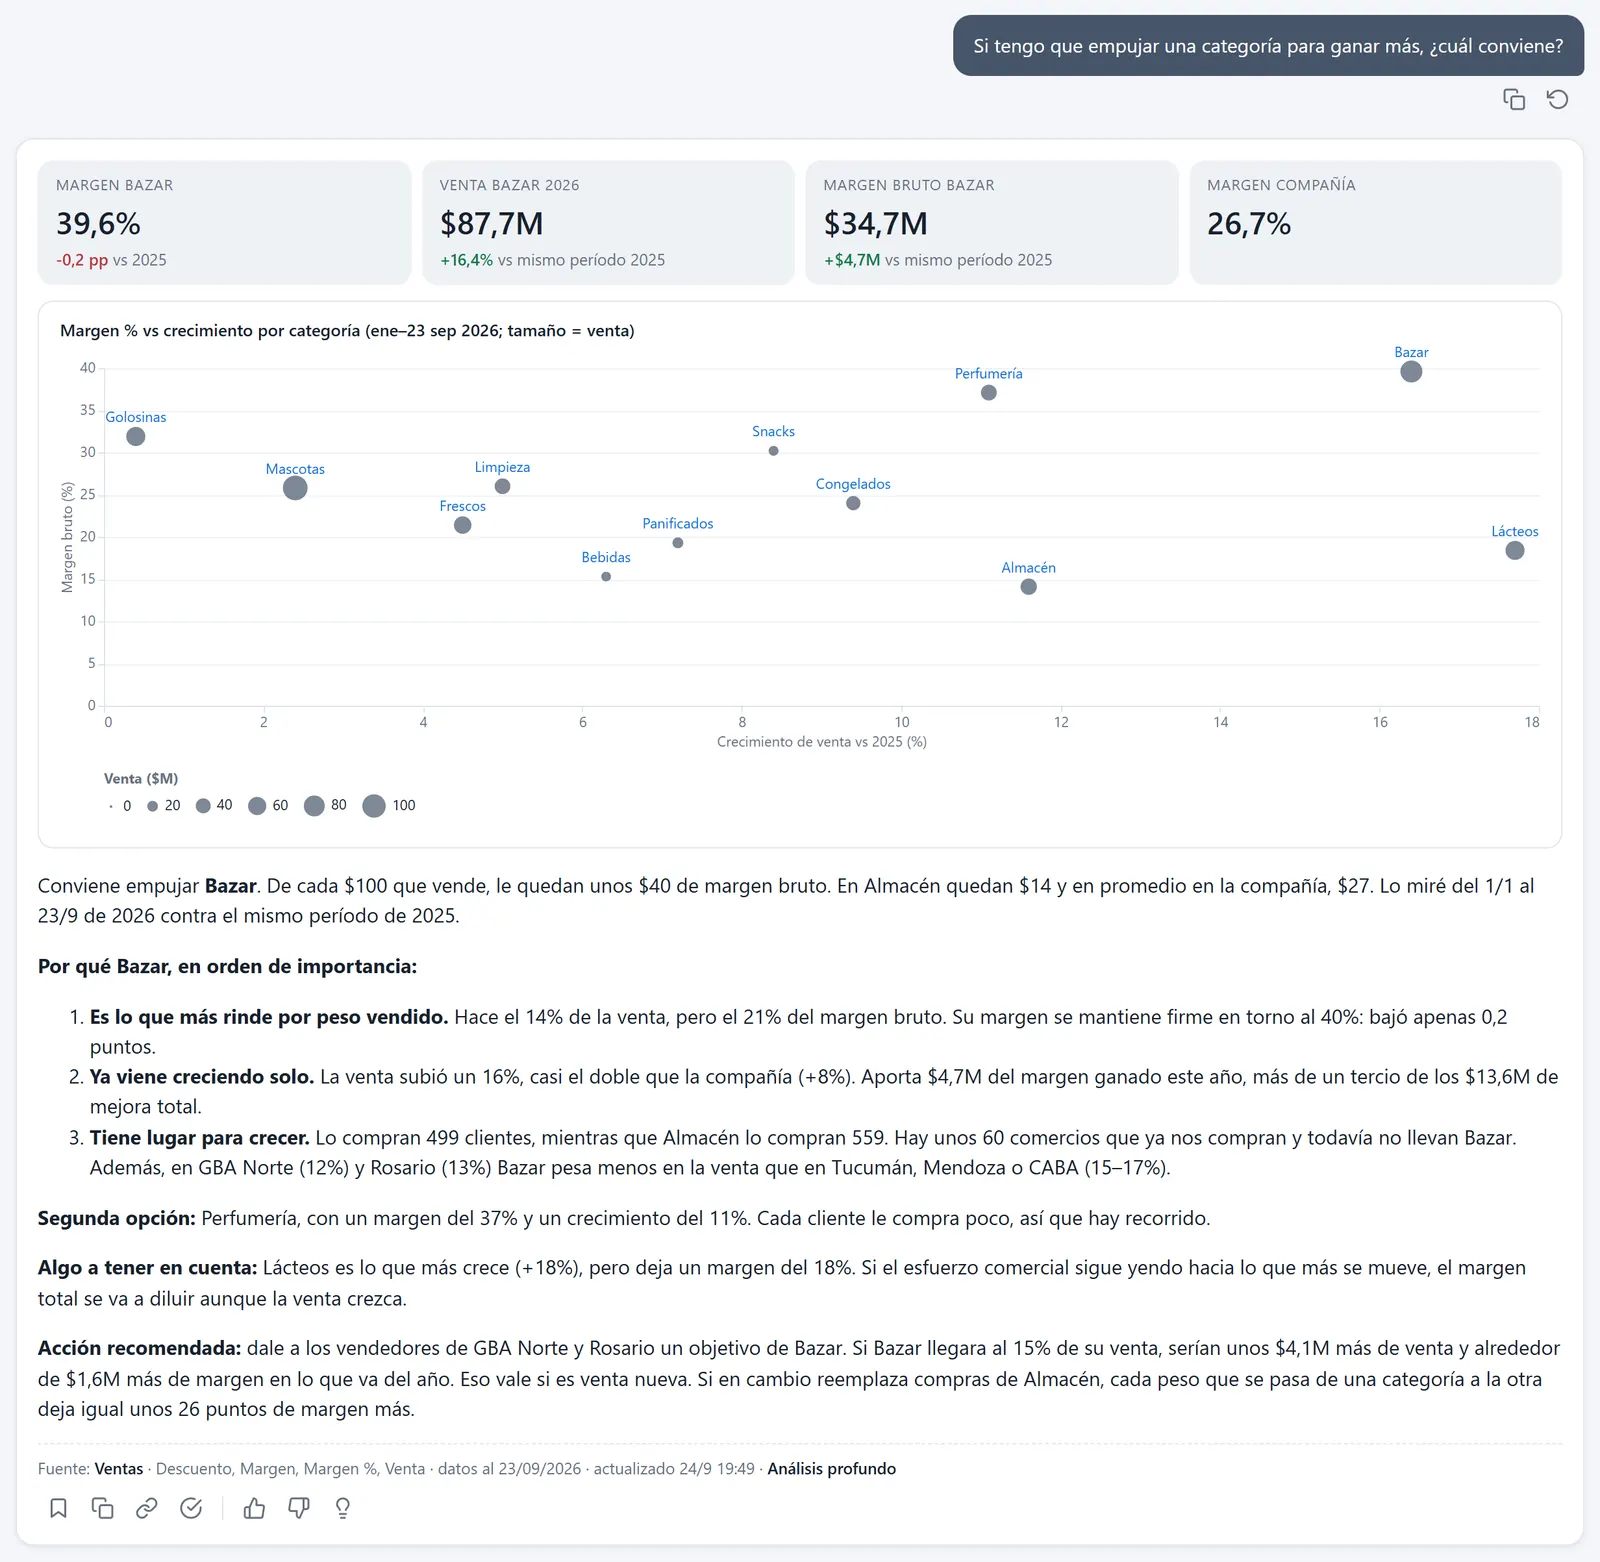
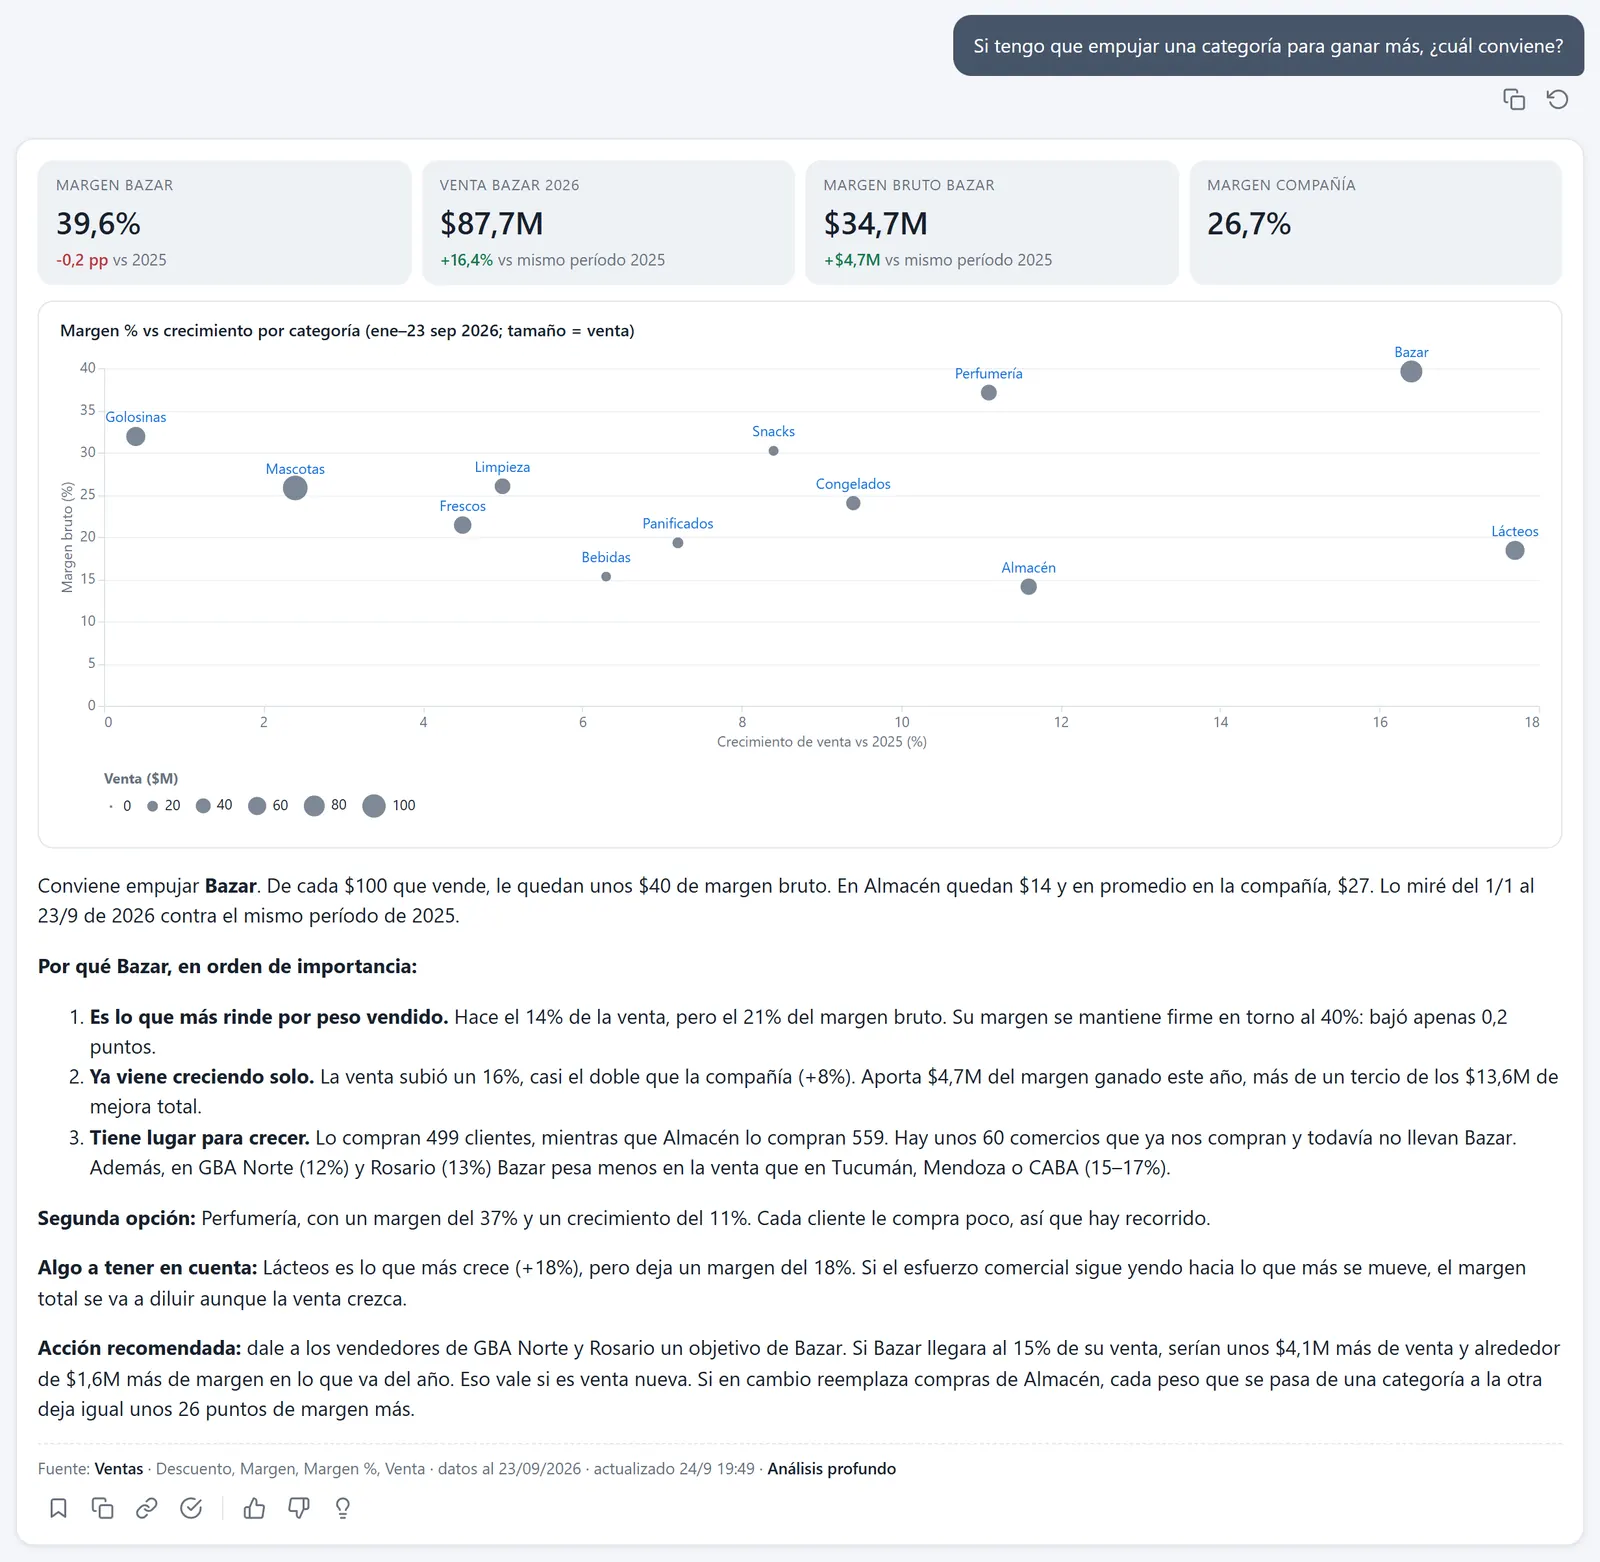
Right: Housewares, with the best margin — close to 40% — and enough weight.
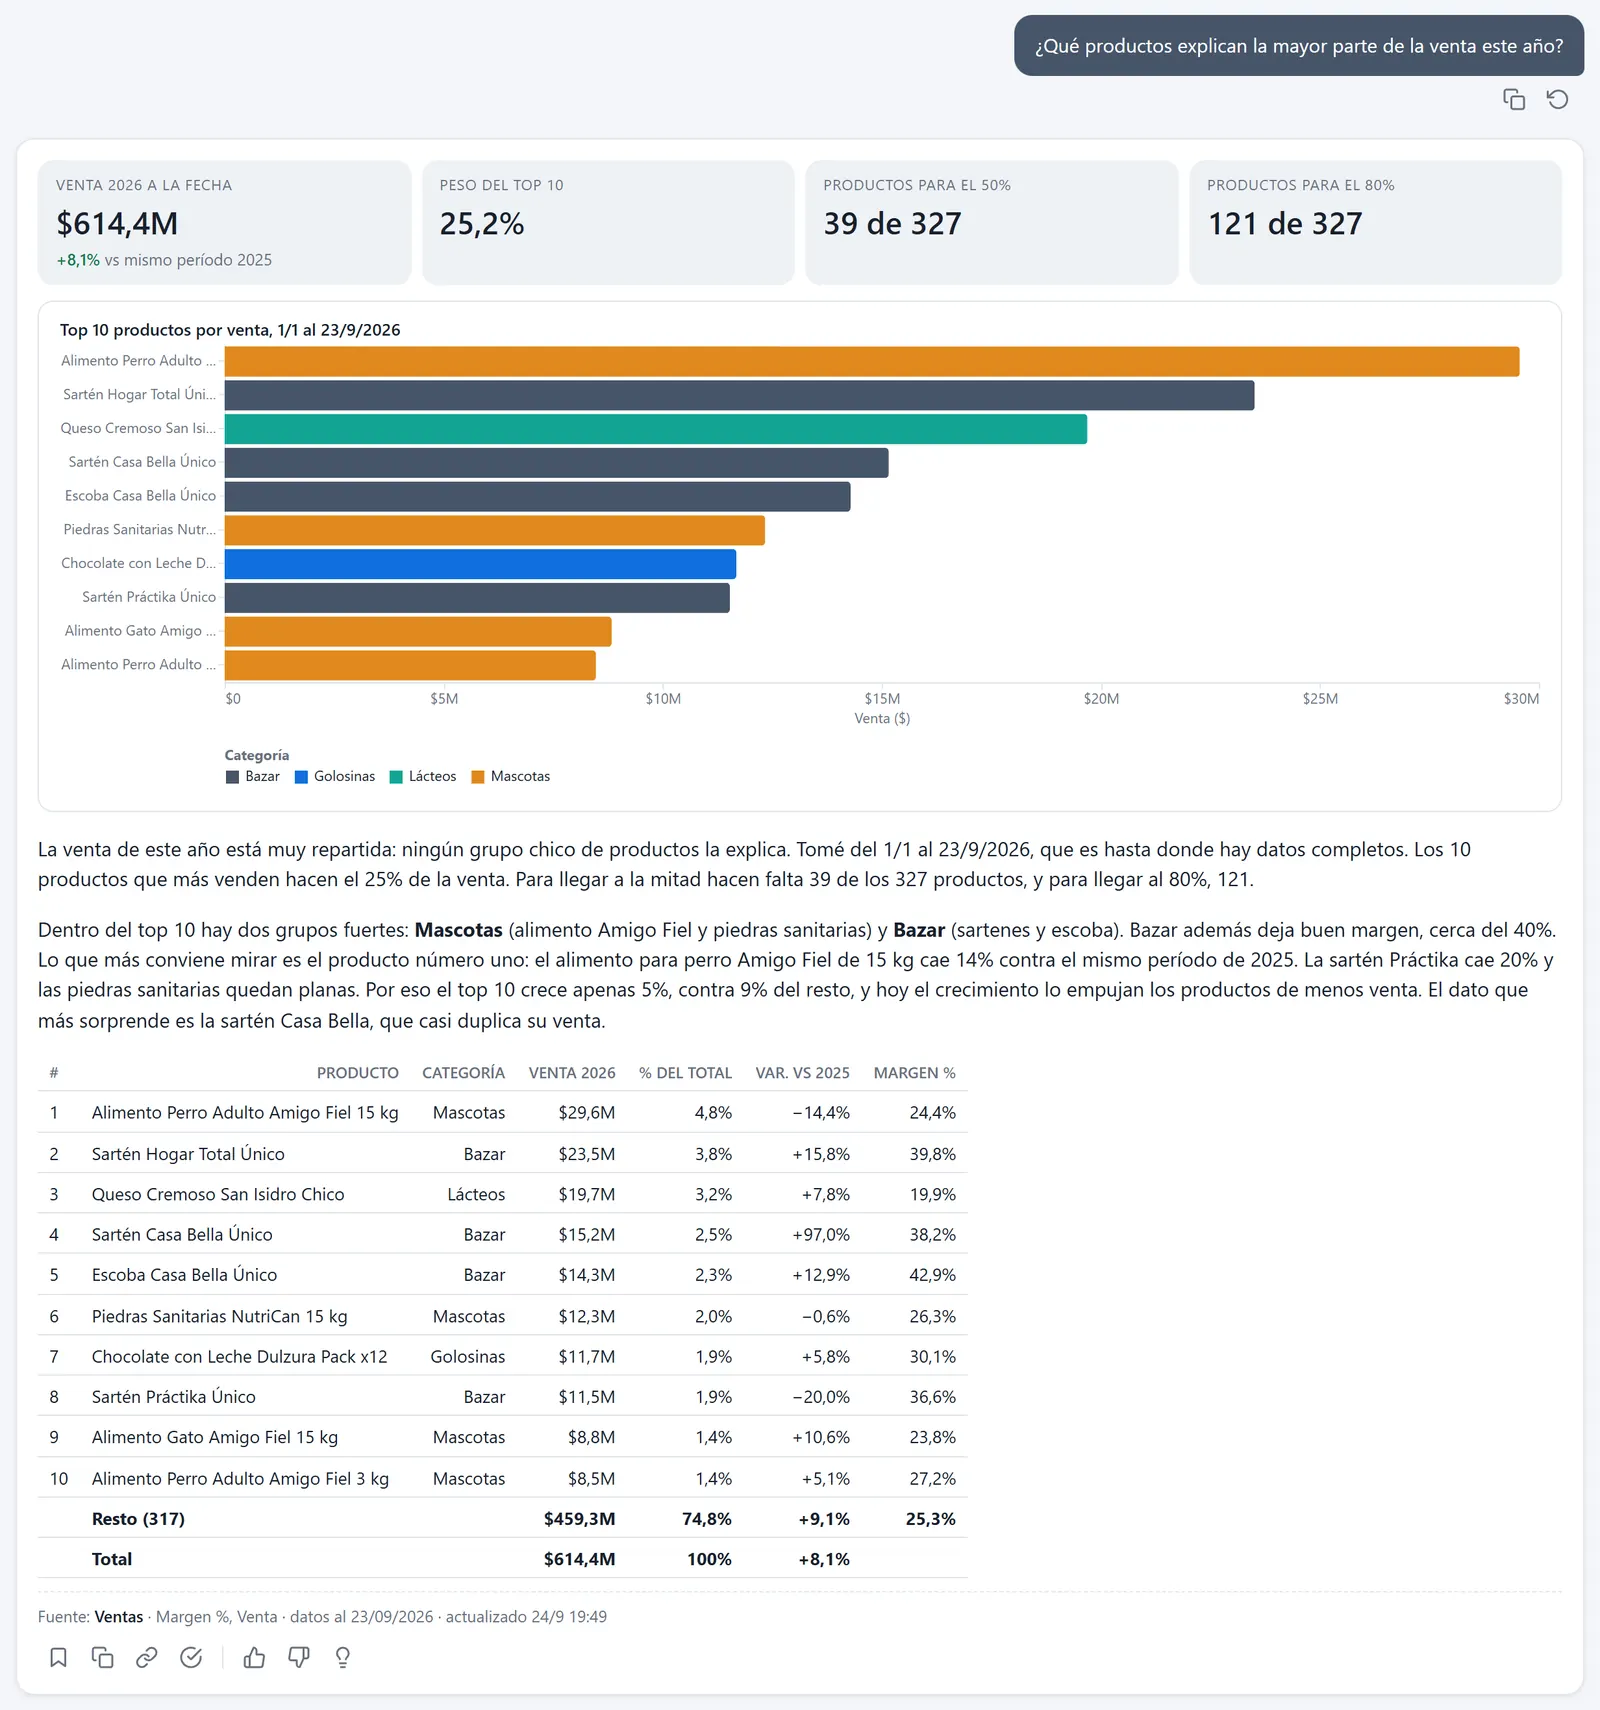
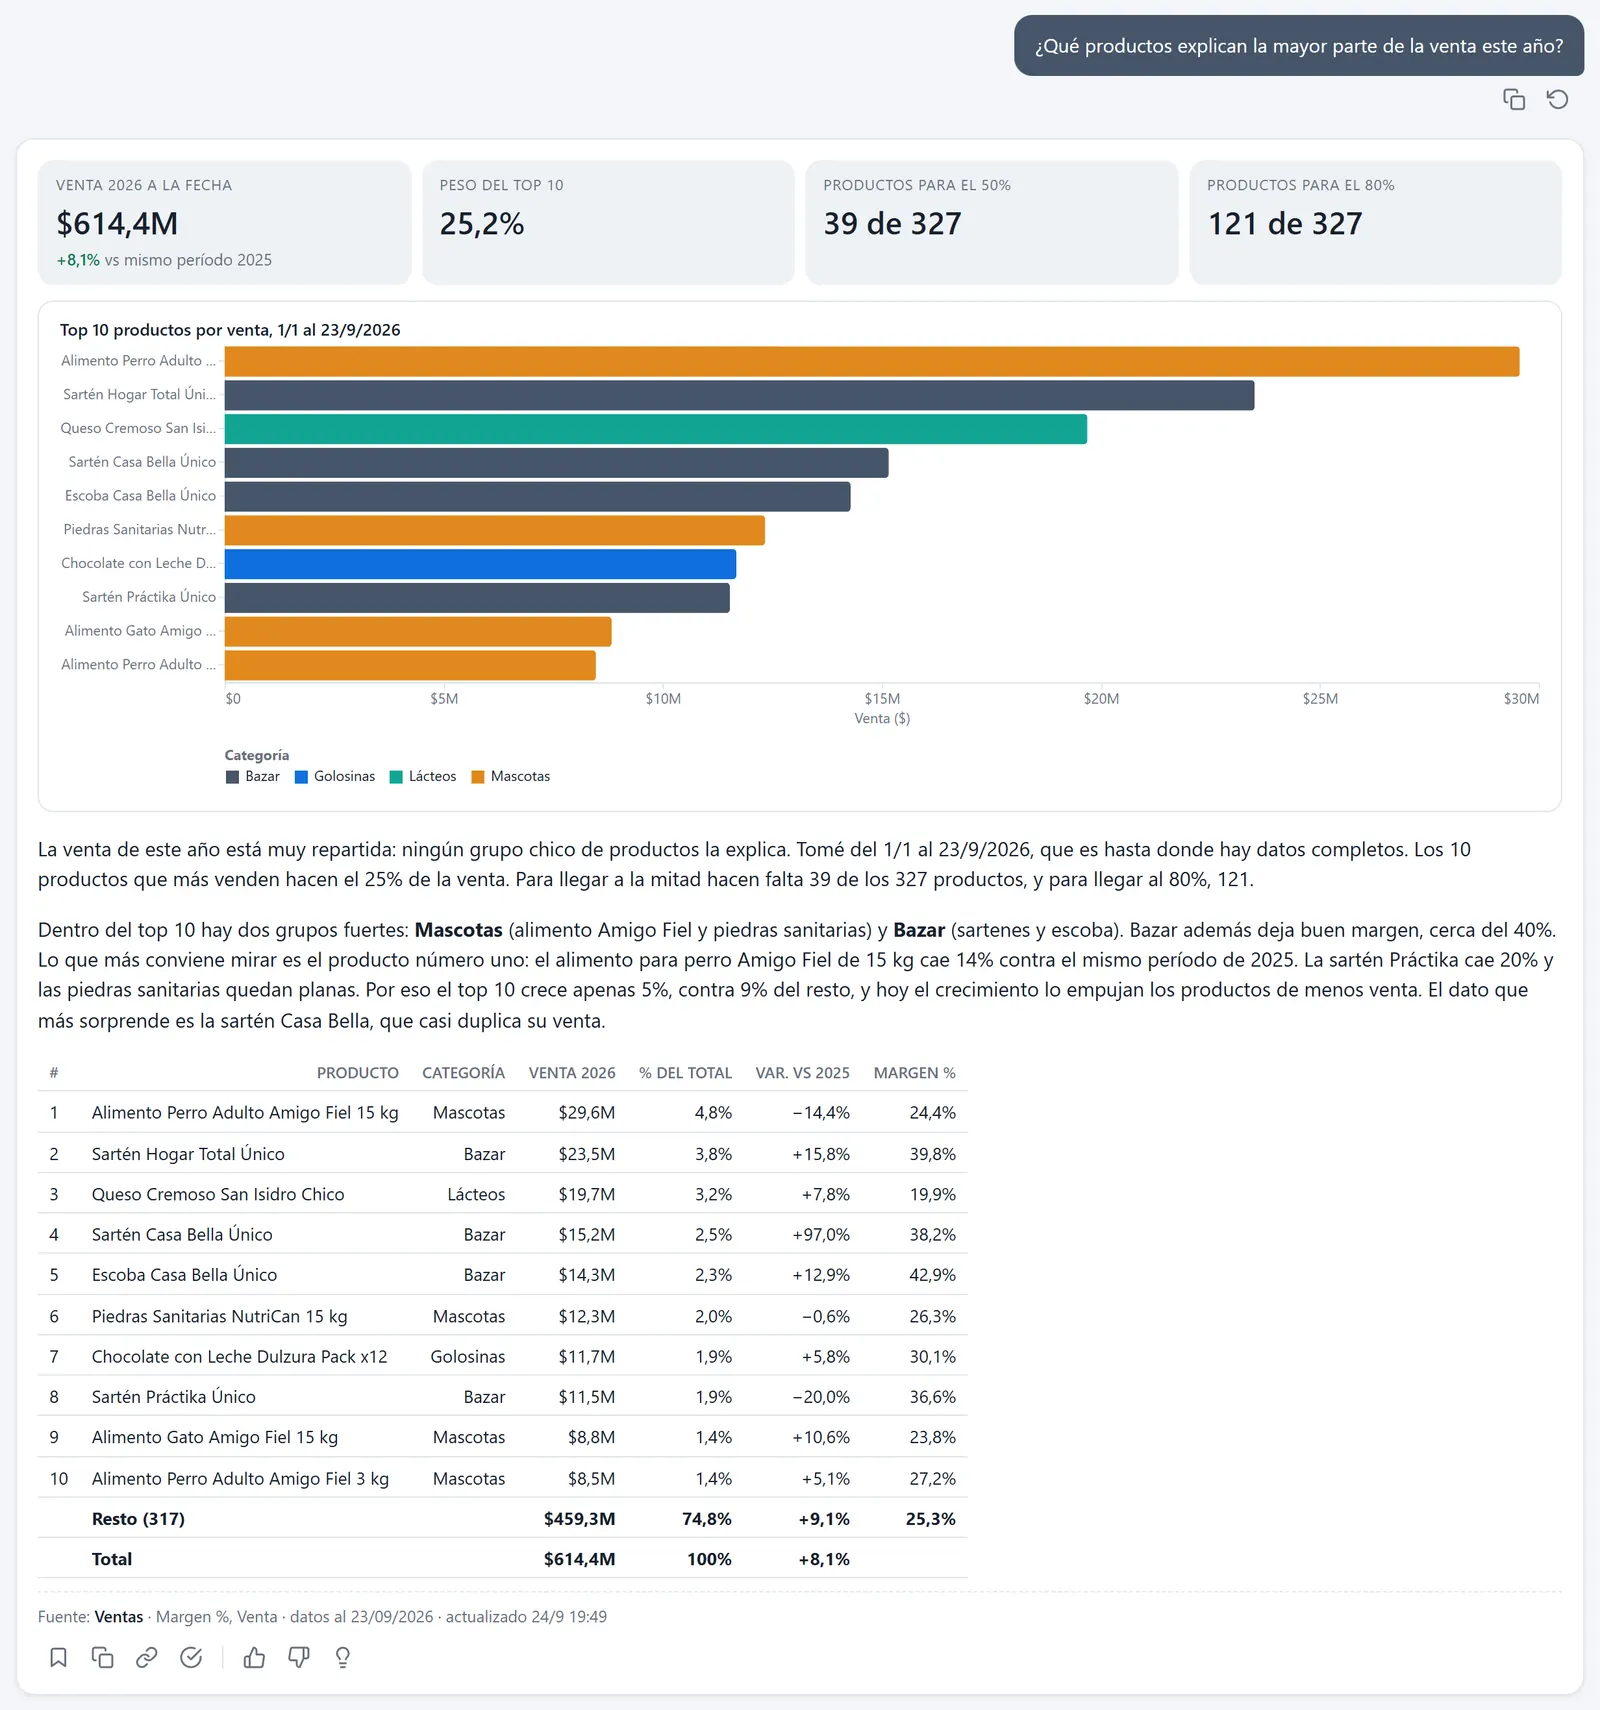
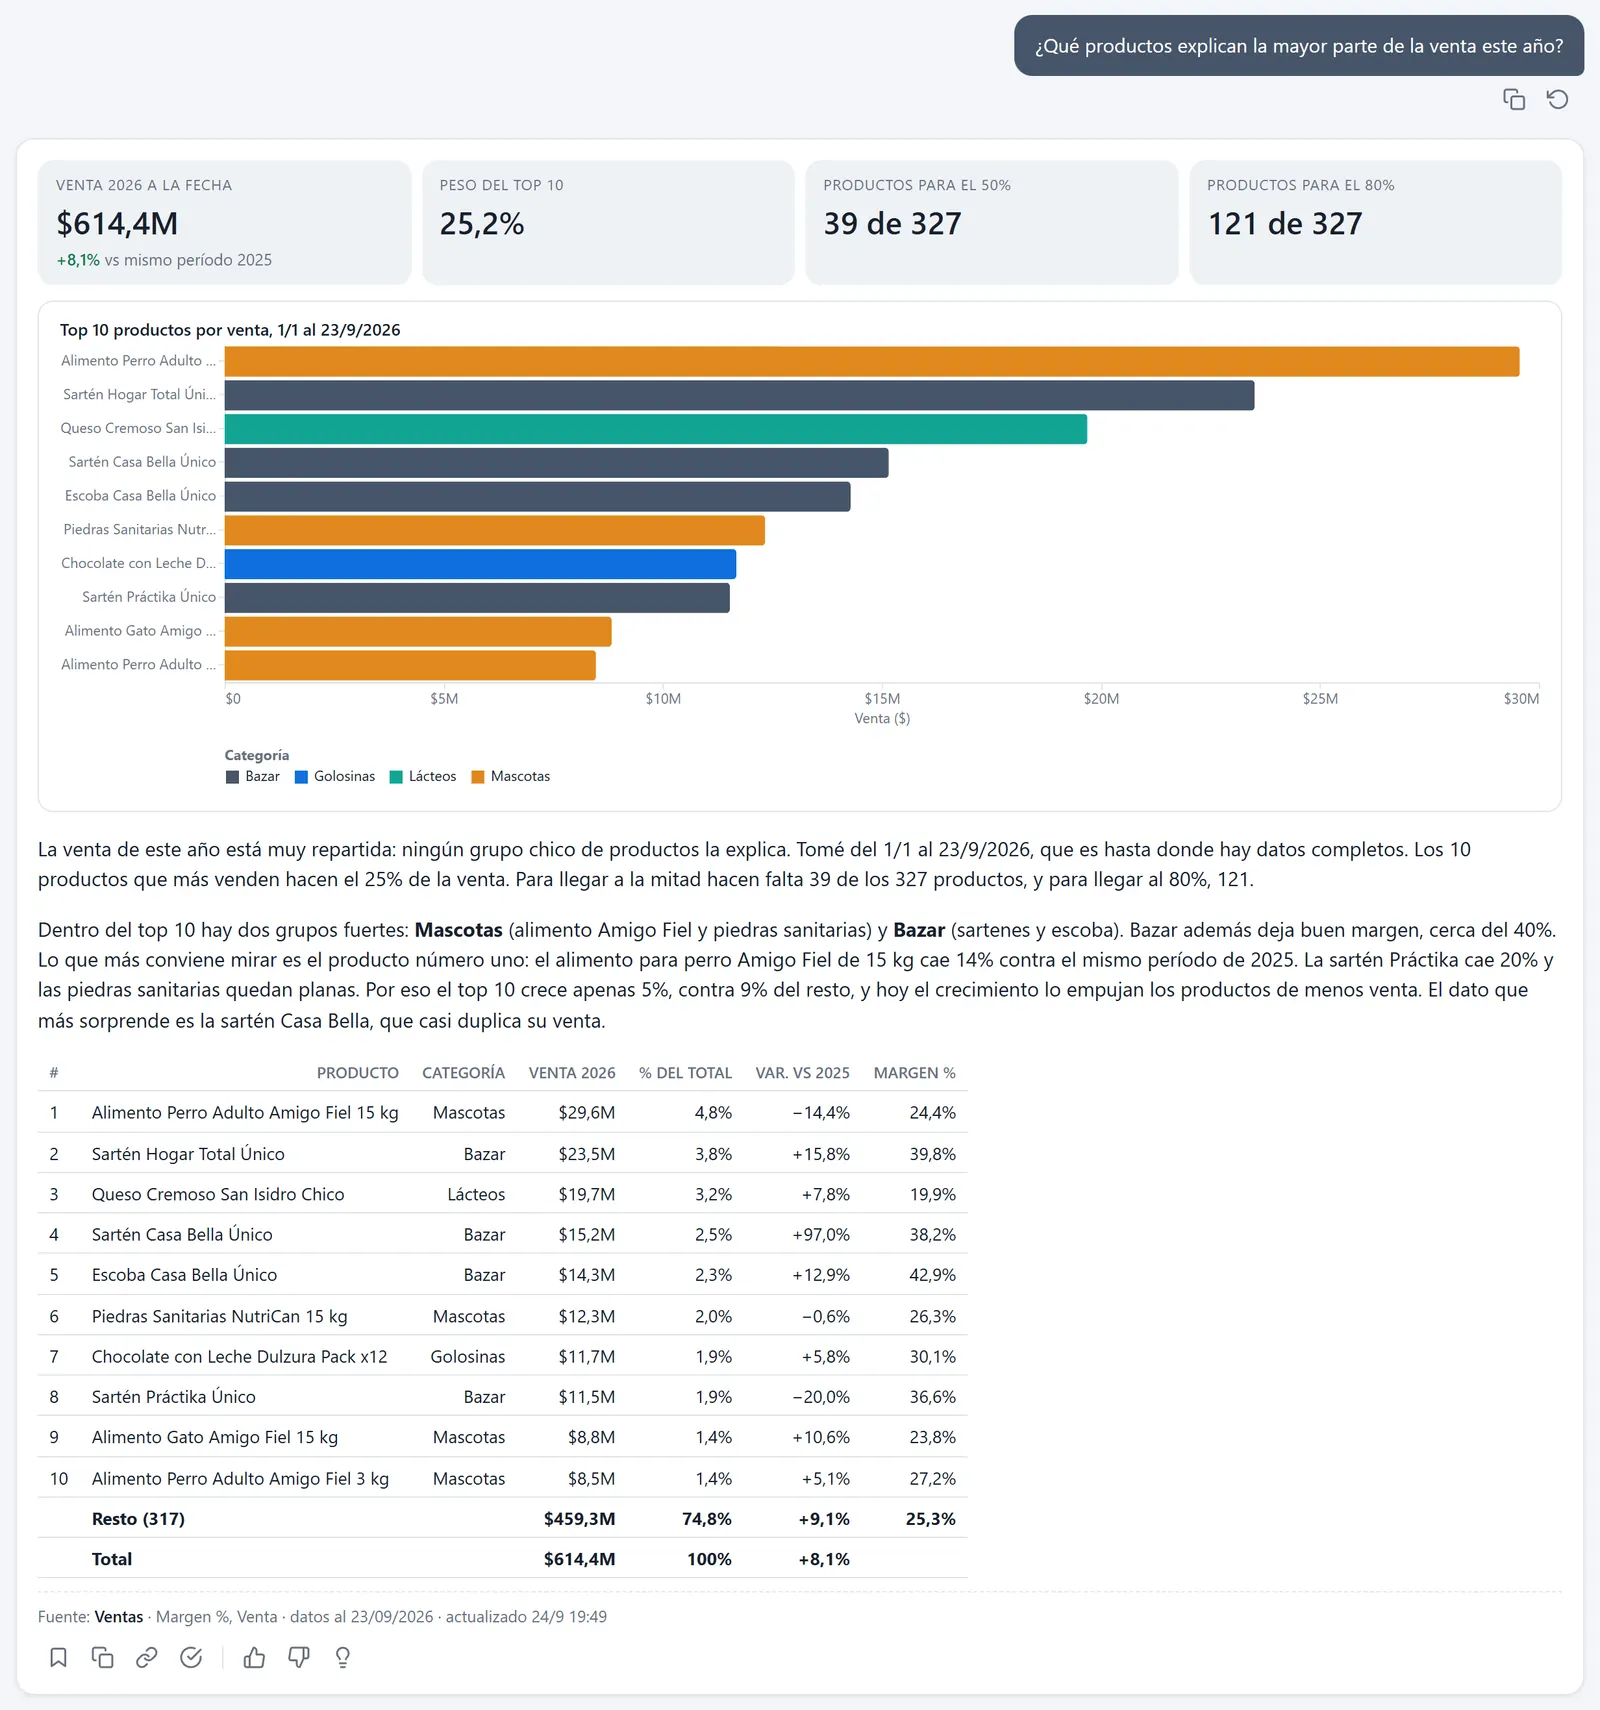
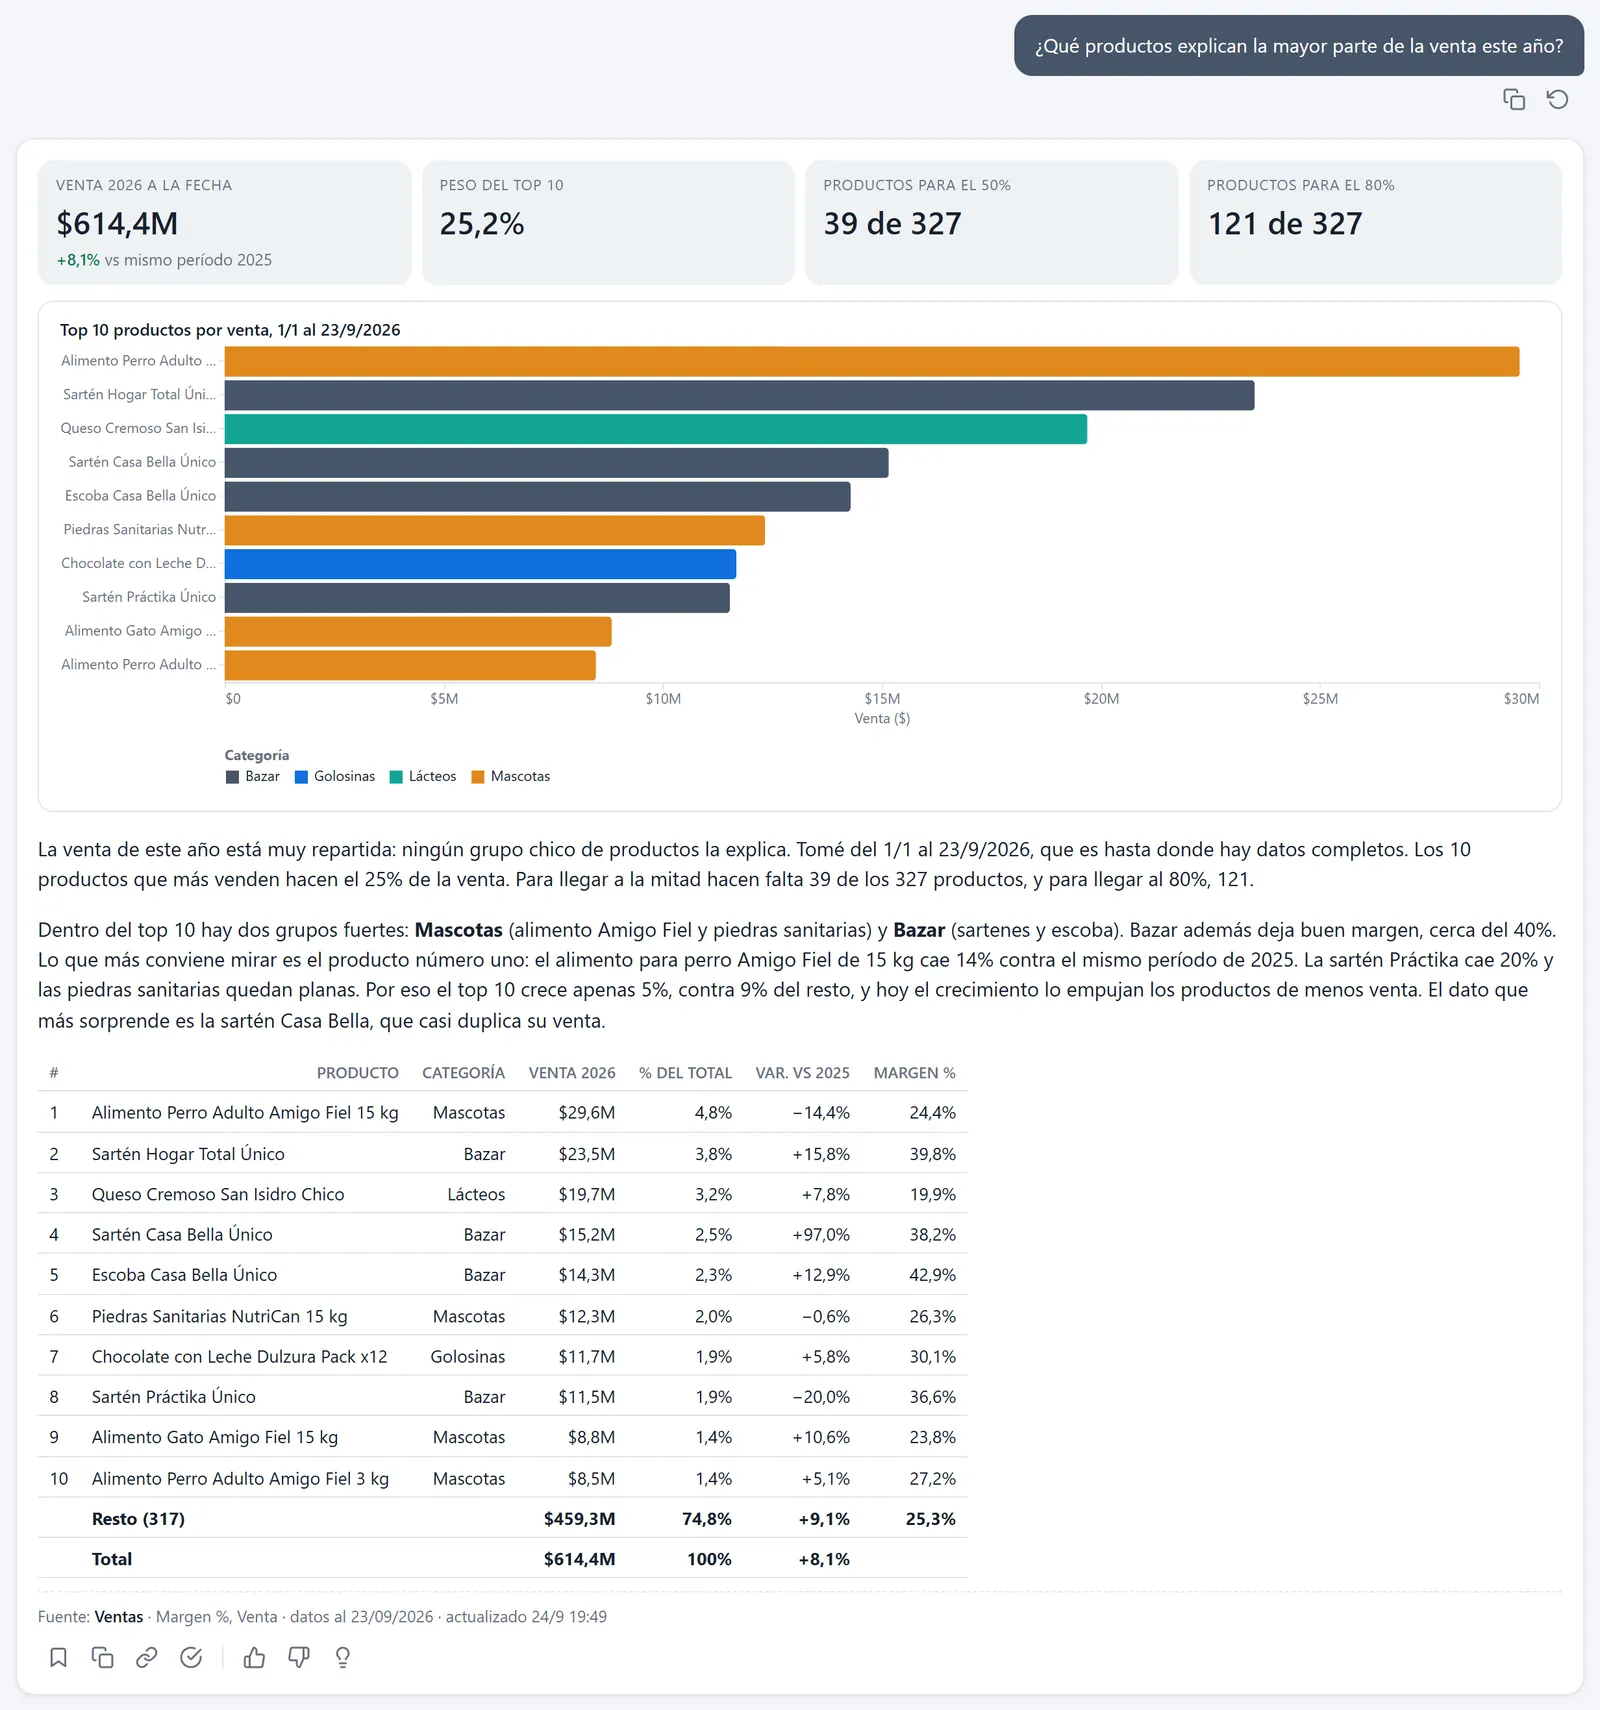
Right: sales are not concentrated. The top ten are 25%, and reaching 80% takes 121 products.
All four agents queried the same Power BI model. It is not set up for IQ: it is set up so that any agent can read it — measures with descriptions, the words the business uses, and the technical parts hidden. With more detailed questions, saying which period, against what and using which measure, Copilot, the Data Agent and Claude would do better than they do here. But nobody in a company asks that way: they ask the way they would ask a colleague. IQ does that work on the product side, not the user's.
Claude Desktop, with the Power BI model and an analyst driving it, gets to almost everything: it compares like with like, projects and proposes. IQ adds what is missing for a director to use it, every day.
It finds the other number.The 549 million is missing August 31. Claude on its own asks for the figure; IQ finds it.
One reading, not two.Rosario alone owes more than the entire shortfall. Adding that Cordoba offsets it mixes two things that do not go together.
In business words.No measure names, no technical messages in the middle.
With charts.Month by month, the waterfall of the bottom line, attainment by branch. Nothing to build.
For anyone in the company.Nothing to install and nothing to connect, on the phone too, with spend under control.